March 13, 2026 17:04 NGAS – Technical Analysis – 4h The technical analysis of the asset reveals a mixed landscape with signs of bullish trends but potential for consolidation. Recent pullbacks suggest investor caution. The…
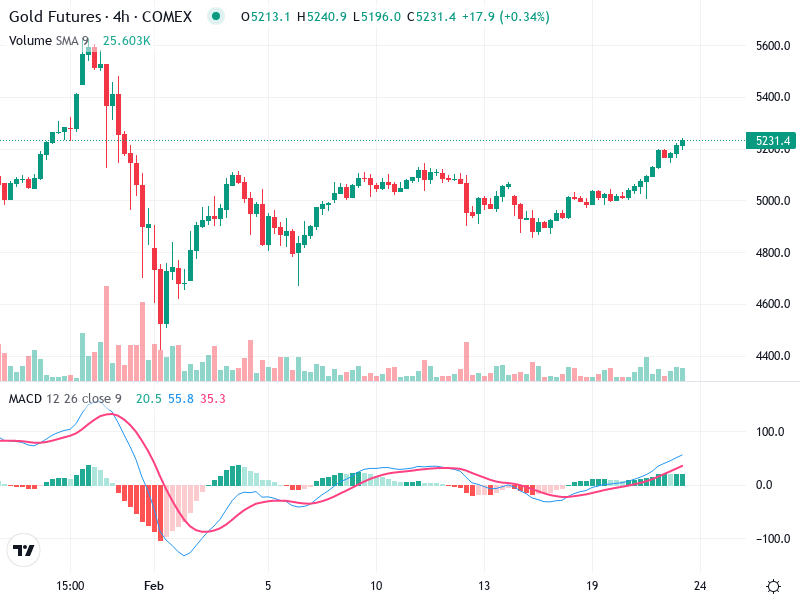
March 13, 2026 17:02 GOLD – Technical Analysis – 4h The gold futures chart indicates a noticeable bearish sentiment in the short term. Technical indicators suggest selling pressure dominates, with critical support levels being tested.…
March 13, 2026 17:00 OIL – Technical Analysis – 4h The chart exhibits a notable bullish trend, characterized by higher highs and higher lows leading to a recent peak. With significant interest from buyers, patterns…