Generic selectors
Exact matches only
Search in title
Search in content
Post Type Selectors

Popular stocks

Crypto

CFD

Currencies

Support

Gold

NZD/USD – Technical Analysis – 4h

February 24, 2026 13:00

Quick Summary

The chart of Asset reveals a consistent trend that traders need to carefully analyze. The prevailing patterns and indicators suggest significant movements in the near term. Understanding these dynamics will be crucial for making informed trading decisions.

Candlestick Analysis

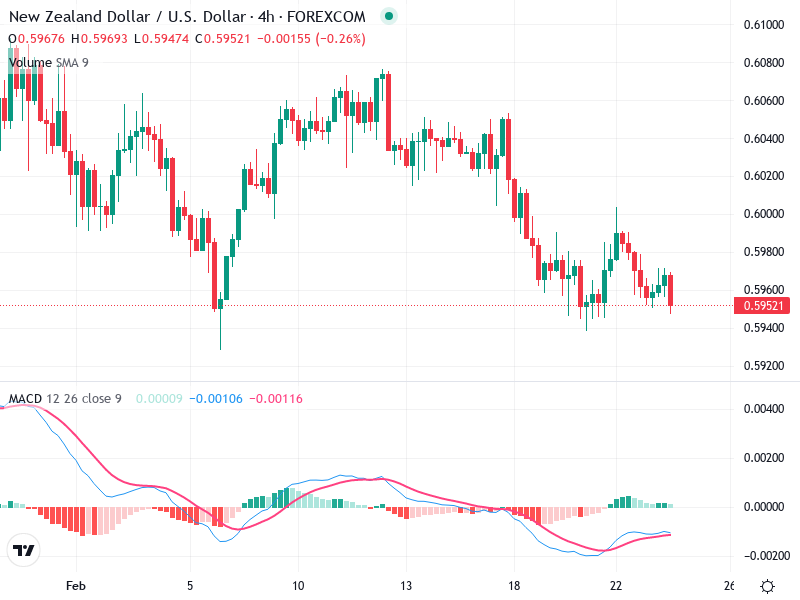
A noticeable doji appears around the middle of the chart, indicating indecision in the market. This often suggests a potential reversal or continuation of the trend, depending on subsequent candles.

Recent candles show smaller bodies, indicating consolidation around the 0.59500 level.

The overall trend appears bearish, with lower highs and lower lows visible throughout the chart.

MACD Analysis

The MACD line is slightly below the Signal line, suggesting bearish momentum.

The histogram bars have turned slightly positive recently, showing a decrease in bearish momentum. However, it is still near zero, indicating weak momentum.

There is no significant divergence observed between the MACD and the price action currently.

Volume Analysis

Volume has been relatively stable with occasional spikes corresponding to movements in price, such as during pullbacks and breakouts.

The volume does not strongly support any recent price movements, indicating lack of strong buyer or seller conviction.

No significant unusual spikes suggestive of institutional activity are present.

Support & Resistance

Support at approximately 0.59500, where price action shows hesitation to break lower.

Resistance around 0.60000, a previous high that may serve as a ceiling.

A clear breakout zone around the 0.60000 level is visible, which could serve as a resistance.

Actionable Insights

Consider short positions if the price convincingly breaks below 0.59500 with increased volume, targeting previous lows.

Consider long positions if the price can break and hold above 0.60000, potentially targeting higher resistance levels.

Watch for a confirmed reversal pattern like a bullish engulfing on increased volume, which could signal a reversal.

The AI Technical Analysis Center is an informational tool only and does not constitute investment or trading advice.
This site is registered on wpml.org as a development site. Switch to a production site key to remove this banner.