Generic selectors
Exact matches only
Search in title
Search in content
Post Type Selectors

Popular stocks

Crypto

CFD

Currencies

Support

Gold

GOLD – Technical Analysis – 4h

February 24, 2026 17:03

Quick Summary

The chart of reveals a potential bullish trend after a previous sell-off.

The asset is experiencing upward movement with resistance currently tested.

Overall sentiment remains cautiously optimistic with attention to resistance levels.

Candlestick Analysis

The chart shows a general bullish trend after a strong sell-off, with prices moving upwards.

A bullish reversal pattern is noticed with multiple bullish candlesticks following the bottom on the left. No distinct bearish patterns are identified.

There is a minor consolidation zone around 5200, suggesting a pullback might occur here if the price faces resistance.

MACD Analysis

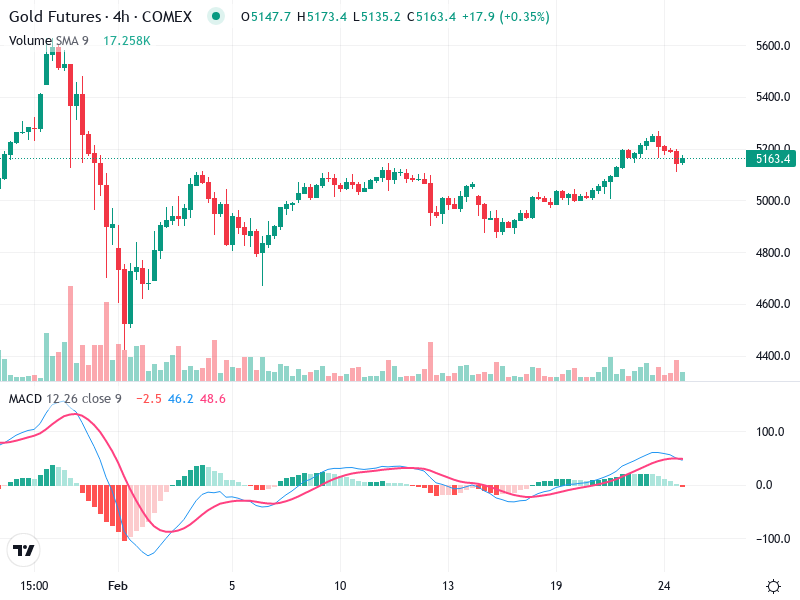
The MACD line is slightly above the Signal line, indicating a recent bullish crossover, yet seems to be converging, suggesting weakening momentum.

The histogram shows positive bars but is decreasing, suggesting that bullish momentum may be slowing.

No clear divergence between the MACD and price action is noted.

Volume Analysis

An increase in volume corresponds to the initial rise in price, supporting the bullish trend. A slight reduction in volume is seen during the latest price rise, suggesting caution.

The notable volume spikes during the initial reversal indicate potential institutional buying.

The volume analysis supports overall market optimism despite recent slowing trends.

Support & Resistance

Around 5000, the level where price previously reversed upwards.

Around 5200, where the price is currently testing, may serve as a near-term resistance level.

Attention should be paid to these levels as they may dictate potential price movements.

Actionable Insights

Consider a hold or buy strategy if price moves above 5200 with increased volume, signaling a breakout.

If it fails and reverses, potential short-term selling could be considered.

Confirmation of the MACD crossover and volume spikes to validate movement strength is crucial.

The AI Technical Analysis Center is an informational tool only and does not constitute investment or trading advice.
This site is registered on wpml.org as a development site. Switch to a production site key to remove this banner.