Generic selectors
Exact matches only
Search in title
Search in content
Post Type Selectors

Popular stocks

Crypto

CFD

Currencies

Support

Gold

NZD/USD – Technical Analysis – 4h

February 25, 2026 13:00

Quick Summary

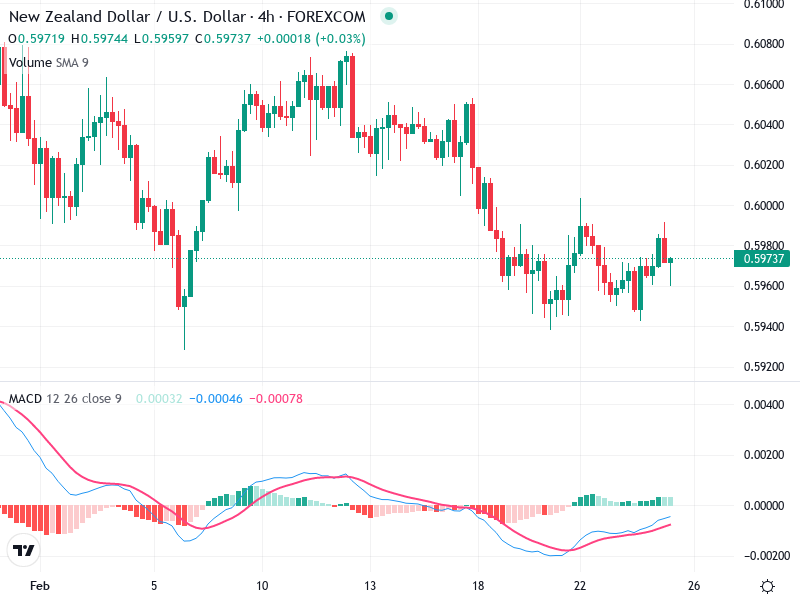
The chart for reveals critical insights worth noting. It shows a notable presence of small body candlesticks, indicating market indecision, alongside bullish candlesticks with longer lower wicks. These patterns suggest potential resistance to lower prices.

The MACD is approaching a bullish crossover, hinting at a shift from bearish momentum. Meanwhile, volume analysis shows a decrease during consolidation phases, suggesting possible accumulation.

Currently, the market remains poised between support at 0.59500 and resistance around 0.60000, with a clear breakout likely determining the subsequent trend.

Candlestick Analysis

In the chart, there is a notable presence of small body candlesticks such as dojis, indicating indecision in the market.

There are also some bullish candlesticks with longer lower wicks, suggesting resistance to lower prices and potential bullish reversal.

The overall trend from early February shows a bearish movement, with some recent consolidation suggesting a sideways move as the market determines its next direction.

MACD Analysis

Currently, the MACD line is attempting a bullish crossover with the signal line. This is a tentative indication of a potential bullish shift.

The histogram is moving from negative to less negative, suggesting decreasing bearish momentum and the possibility of a bullish phase developing.

No clear divergences are visible at this point, but upcoming price movements should be watched for signs of divergence.

Volume Analysis

There was a noticeable increase in volume during recent price drops, indicating selling pressure.

However, volumes are slightly decreasing as the price consolidates, which can be typical in consolidation phases.

The declining volume with consolidation suggests a potential accumulation phase, where traders are waiting to see a decisive move.

Support & Resistance

The 0.59500 region has been tested multiple times as support.

Resistance stands around 0.60000, where the price has failed to sustain a move above.

A clear breakout above the resistance or below the support may signal the next directional movement.

Actionable Insights

Traders can consider a range-bound strategy between 0.59500 and 0.60000 until a clear breakout occurs.

Consider entering long positions if there's a confirmed break above 0.60000 with increased volume.

Consider selling if the price breaks below 0.59500 with volume support. Watch for confirmation of the MACD crossover for a more decisive bullish entry.

The AI Technical Analysis Center is an informational tool only and does not constitute investment or trading advice.
This site is registered on wpml.org as a development site. Switch to a production site key to remove this banner.