Generic selectors
Exact matches only
Search in title
Search in content
Post Type Selectors

Popular stocks

Crypto

CFD

Currencies

Support

Gold

GBP/USD – Technical Analysis – 4h

February 25, 2026 13:04

Quick Summary

The candlestick patterns on the asset’s chart reflect a persistent bearish trend since early February, with some recovery attempts noted. A detailed examination indicates potential consolidation, as small-bodied candlesticks like doji or spinning tops are emerging. This analysis comprises the comprehensive observation of various indicators and price movements.

Candlestick Analysis

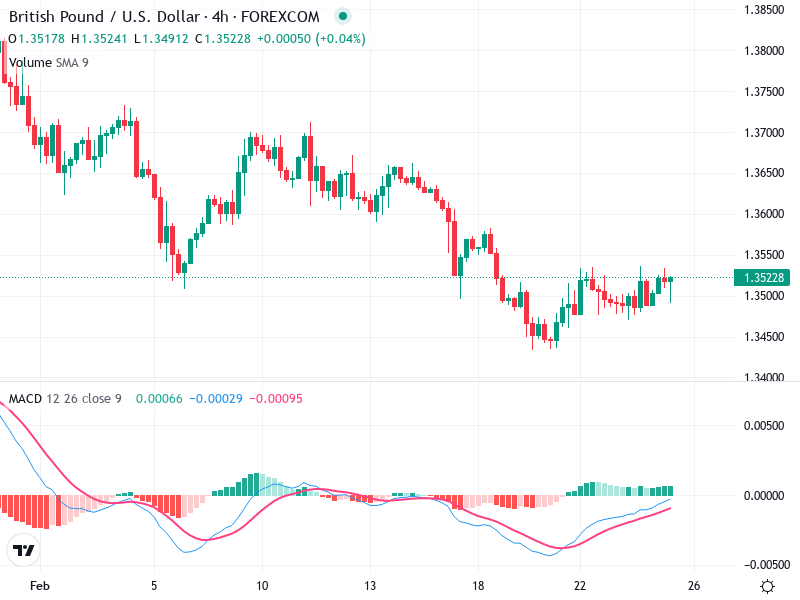
The chart currently shows a bearish trend that has been ongoing since early February, with some recovery attempts.

Recently, there is a noticeable formation of small-bodied candlesticks indicating indecision—possibly doji or spinning top patterns—suggesting potential consolidation.

Recent lows around 1.3450 acted as a support level, while the 1.3550 level currently serves as a minor resistance to watch for breakouts.

MACD Analysis

The MACD line is approaching the Signal line from below, suggesting an imminent bullish crossover. This could indicate a shift in momentum if confirmed.

The histogram is beginning to turn positive after an extended period of being below zero, supporting a potential shift to bullish momentum.

No significant divergences between MACD and price action are visible, keeping the alignment in trend.

Volume Analysis

There was a notable increase in volume as prices approached the recent low, suggesting buying interest or accumulation at support levels.

The recovery from recent lows is accompanied by a moderate increase in volume, mildly supporting the recent price upturn.

There's no apparent unusual spike in volume that would suggest major institutional activity.

Support & Resistance

1.3450 is a key support level that has recently held against bearish pressure.

1.3550 functions as a critical resistance. A break above this could signal a continued bullish move.

These levels are crucial for identifying potential reversal or breakout points.

Actionable Insights

Consider looking for buying opportunities if the price breaks and sustains above the 1.3550 resistance, especially if supported by volume.

Look for shorting opportunities if the price falls below the 1.3450 support with increased volume.

If the price remains within this range, it may be prudent to wait for clearer directional signals.

The AI Technical Analysis Center is an informational tool only and does not constitute investment or trading advice.
This site is registered on wpml.org as a development site. Switch to a production site key to remove this banner.