Generic selectors
Exact matches only
Search in title
Search in content
Post Type Selectors

Popular stocks

Crypto

CFD

Currencies

Support

Gold

OIL – Technical Analysis – 4h

February 26, 2026 17:00

Quick Summary

The Crude Oil Futures 4-hour chart demonstrates recent bullish momentum. Key technical indicators suggest potential upward movement, supported by various analysis methods. The asset is currently engaging with crucial support and resistance levels.

The market sentiment appears to be aligned with a bullish outlook as the asset remains positioned for further gains, provided current technical signals are adhered to.

Candlestick Analysis

The chart shows a recent bullish engulfing pattern near the price level of 64.00, indicating a potential reversal from the downtrend. This pattern is followed by strong bullish candles pushing the price upward.

The market has shown a sideways trend with recent bullish momentum. This bullish sentiment is evident following a pullback to the 64.00 level.

The strong bullish candle breaking above the recent consolidation range around 65.00-66.00 indicates a possible bullish breakout.

MACD Analysis

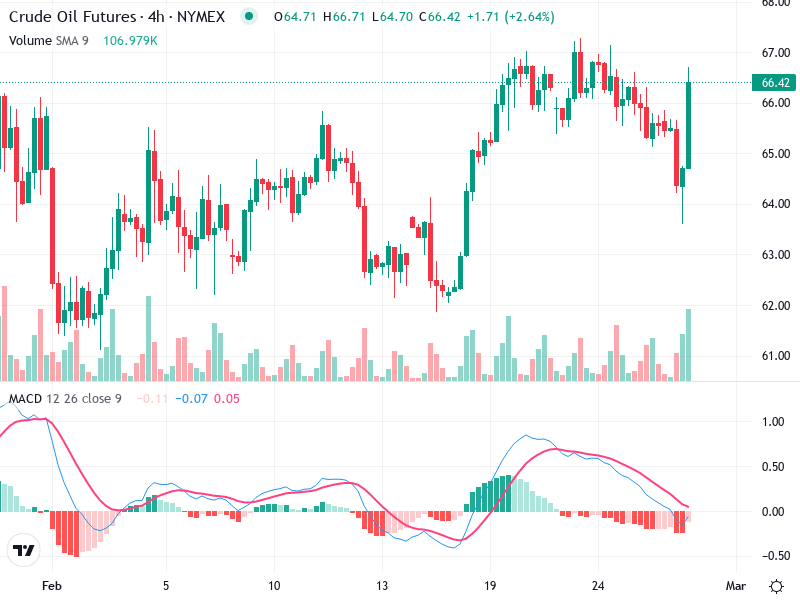
The MACD line is crossing above the Signal line from below, suggesting a bullish crossover, which often precedes upward momentum.

The histogram is moving from negative to positive, reinforcing the bullish momentum.

There are no significant divergences between the MACD and the price action currently, supporting that the MACD confirms the upward movement.

Volume Analysis

There is an increase in volume accompanying the recent bullish candles, which supports the price movement. Higher volume on upward moves indicates strong buyer interest.

The noticeable volume spike during the latest bullish breakout may suggest institutional buying.

Support & Resistance

Key support is around the 64.00 level, where the market recently reversed.

The price is approaching a resistance zone at around 67.00, which has been tested previously in the chart.

Actionable Insights

A potential buy strategy would involve entering at or around the current breakout level of 66.00-66.50, targeting the next resistance level of 67.00-68.00, while placing a stop-loss below 64.00.

Current holders might watch for a break above the 67.00 resistance to confirm continued bullish momentum.

If bearish candlestick patterns form near the 67.00 resistance, consider short positions or taking profits.

The AI Technical Analysis Center is an informational tool only and does not constitute investment or trading advice.
This site is registered on wpml.org as a development site. Switch to a production site key to remove this banner.