Generic selectors
Exact matches only
Search in title
Search in content
Post Type Selectors

Popular stocks

Crypto

CFD

Currencies

Support

Gold

GOLD – Technical Analysis – 4h

February 26, 2026 17:02

Quick Summary

The chart exhibits an interesting pattern with observable trends and potential breakout points.

Analysis indicates pivotal support and resistance levels impacting current movements.

Overall sentiment appears cautious, awaiting further signals to define direction.

Candlestick Analysis

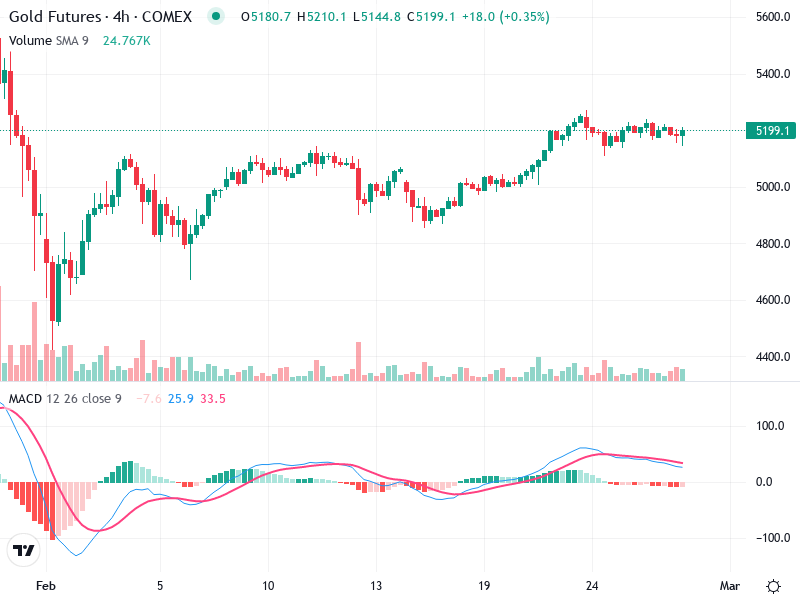
The chart shows a bullish trend with a solid upward movement observed from early February to mid-February.

There are small candlestick bodies with wicks, indicating indecision in the market and possible consolidation.

The recent sideways movement around the 5200 level suggests a potential breakout zone, either upwards or downwards.

MACD Analysis

The MACD line is slightly below the Signal line, suggesting a bearish crossover has recently occurred or is in progress.

The histogram shows decreasing bullish momentum, as it transitions from positive to a declining trend.

No clear divergence is visible between the MACD and price action at this point.

Volume Analysis

Volume spikes can be seen during upward price movements, aligning with bullish interest.

Recent decreased volume during sideways movement suggests a lack of conviction in the current price levels.

Noticeable volumes in early February correlated with a strong price move, indicating possible institutional activity.

Support & Resistance

Key support is around 5000, where price rebounded earlier.

Current resistance is near the 5200 level, with multiple rejections observed around this price.

Breaking above 5200 on increased volume could signal a strong bullish continuation.

Actionable Insights

Consider buying if price breaks above 5200 with a strong volume confirmation.

Consider selling if price breaks below the 5000 support level or if MACD confirms a stronger bearish trend.

Holding may be advisable during the current consolidation phase until a clearer trend emerges.

The AI Technical Analysis Center is an informational tool only and does not constitute investment or trading advice.
This site is registered on wpml.org as a development site. Switch to a production site key to remove this banner.