Generic selectors
Exact matches only
Search in title
Search in content
Post Type Selectors

Popular stocks

Crypto

CFD

Currencies

Support

Gold

EUR/USD – Technical Analysis – 4h

February 27, 2026 08:02

Quick Summary

The EUR/USD 4-hour chart displays a combination of potential bullish reversal patterns such as doji and hammer formations. There is a noticeable sideways trend with slight bullish tendencies as recent candles appear to be climbing higher.

Any breakout above the recent highs around the 1.184 level may suggest further bullish momentum, while a pullback below the 1.176 level could indicate additional bearish pressure.

Candlestick Analysis

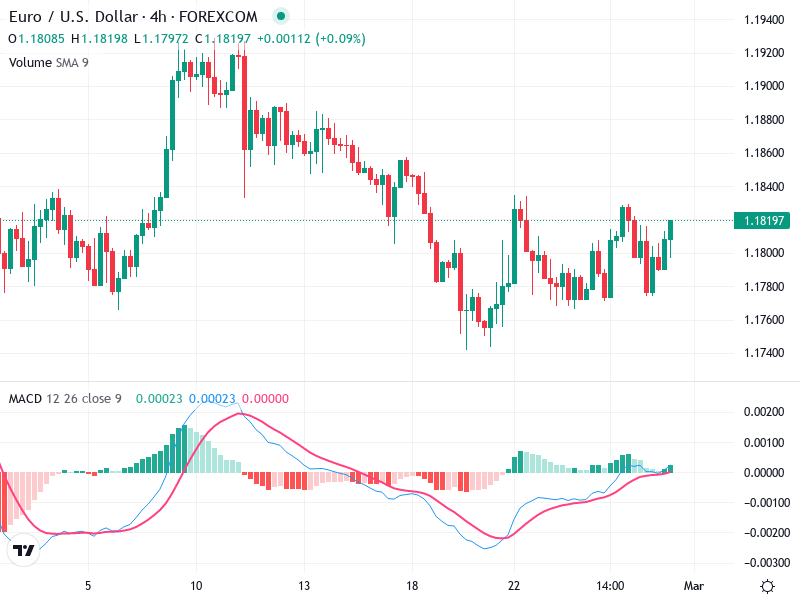
The chart displays a mix of bullish and bearish candlesticks. Notable patterns include potential bullish reversal patterns such as doji and hammer formation, indicating indecision and possible reversals.

The market is showing a sideways trend with slight bullish tendencies as recent candles are climbing higher.

Any breakout above the recent highs around the 1.184 level could indicate further bullish momentum, while a pullback below the 1.176 level might suggest additional bearish pressure.

MACD Analysis

The MACD line is attempting a bullish crossover above the Signal line, which might suggest a potential bullish momentum buildup.

The histogram has shifted from negative to slightly positive, indicating a shift in momentum in the bullish direction.

No clear divergence between MACD and price action is evident; they appear to be in alignment, supporting the current price movement.

Volume Analysis

The volume is generally low, with minor fluctuations that align with price movements. This suggests a lack of strong conviction in either direction.

The lack of volume surge in recent upward movements suggests caution in anticipating a strong trend without further confirmation.

No significant spikes in volume are present, indicating a lack of institutional activity.

Support & Resistance

Around 1.176, serving as a base for recent price action.

Around 1.184, a previous high acting as a potential barrier for further upside.

Breaking these levels could determine the next direction, with resistance break suggesting bullish continuation and support break indicating possible bearish reversal.

Actionable Insights

Consider buying on a confirmed breakout above the resistance at 1.184 with increased volume.

Consider selling if the price breaks below the support at 1.176 with confirming volume.

A hold strategy is plausible if price remains in the current range to await clearer breakout or breakdown.

The AI Technical Analysis Center is an informational tool only and does not constitute investment or trading advice.
This site is registered on wpml.org as a development site. Switch to a production site key to remove this banner.