Generic selectors
Exact matches only
Search in title
Search in content
Post Type Selectors

Popular stocks

Crypto

CFD

Currencies

Support

Gold

AUD/USD – Technical Analysis – 4h

February 27, 2026 13:02

Quick Summary

This technical analysis provides insights into the recent price movements and potential future trends of the asset. The asset has experienced a bullish trend followed by a period of consolidation. Key support and resistance levels are also noted, offering guidance on possible breakout or breakdown scenarios.

Candlestick Analysis

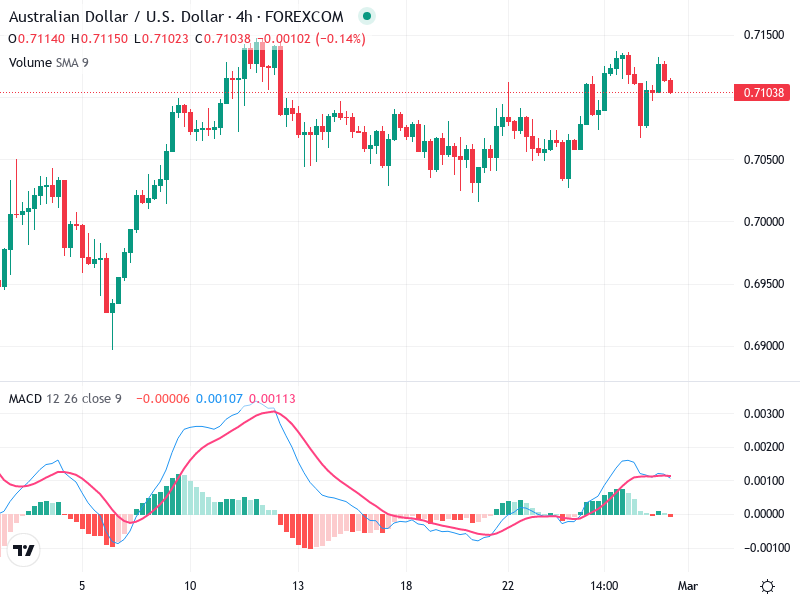
The asset currently shows no prominent candlestick patterns such as bullish engulfing or hammer that suggest a significant reversal.

Recently, there is a sideways movement after a bullish movement, indicating consolidation.

The overall trend displays a recent bullish trend, followed by sideways consolidation. This could indicate a pause before a potential continuation of the trend.

MACD Analysis

The MACD line is slightly above the Signal line, indicating a potential bullish trend continuation, although it appears to be flattening, suggesting weakening momentum.

The histogram shows decreasing bullish momentum as the bars are contracting towards the zero line. This could suggest consolidation.

There are no clear divergences indicating a strong reversal or trend change.

Volume Analysis

Volume appears steady with no significant spikes that could signal aggressive buying or selling pressure.

The current price consolidation is matched by reduced volume, which is typical in a sideways market phase.

Overall, the volume analysis shows a stable volume activity with no major changes influencing price movement at the moment.

Support & Resistance

The 0.71500 level is a key resistance zone, where the price has repeatedly failed to break through.

Support is seen around 0.70000, where the price has bounced back previously.

These levels serve as important indicators for potential breakout or breakdown scenarios in the near term.

Actionable Insights

Consider buying if the price breaks and closes above the 0.71500 resistance with increased volume, which could signal a bullish continuation.

A breakdown below 0.70000 with significant volume could indicate a bearish move, providing a potential shorting opportunity.

Monitor for a breakout above resistance or breakdown below support for confirmation of the next trend direction.

The AI Technical Analysis Center is an informational tool only and does not constitute investment or trading advice.
This site is registered on wpml.org as a development site. Switch to a production site key to remove this banner.