Generic selectors
Exact matches only
Search in title
Search in content
Post Type Selectors

Popular stocks

Crypto

CFD

Currencies

Support

Gold

OIL – Technical Analysis – 4h

February 27, 2026 17:01

Quick Summary

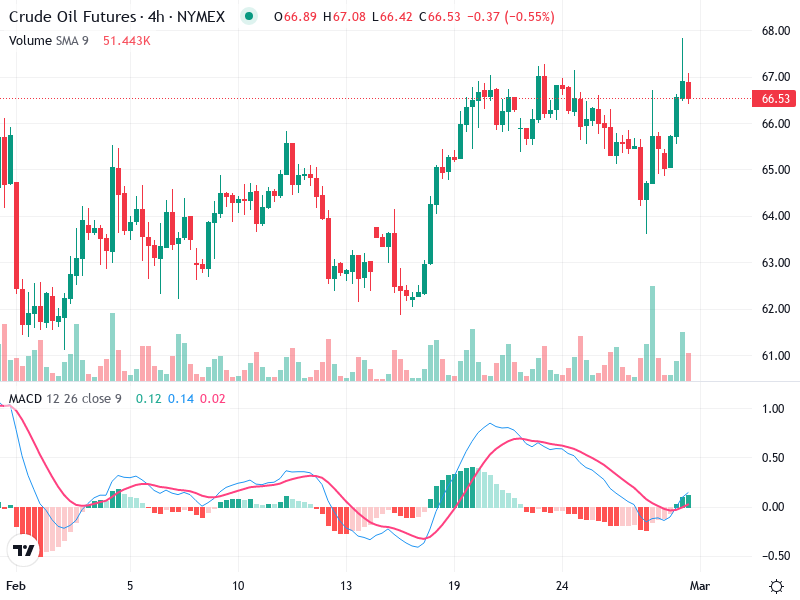
The chart for indicates a continuation of the bullish trend established mid-February, showcasing a series of higher highs and higher lows. However, there is a noticeable pullback towards the chart’s end, which warrants attention.

The asset is currently navigating a consolidative phase, as suggested by recent volume trends, which could precede a potential breakout.

Candlestick Analysis

The appearance of a bullish engulfing candle around mid-February indicates the beginning of an upward trend, suggesting a potential reversal from bearish to bullish sentiment.

Recent candles with long wicks highlight possible indecision or rejection at higher levels.

The overall trend shows bullish characteristics post-engulfing pattern, yet ends with a minor pullback.

MACD Analysis

A bullish crossover occurs as the MACD line crosses above the signal line, indicating positive momentum.

The MACD histogram reflects increasing bars above the zero line, reinforcing bullish sentiment with growing momentum.

No divergence observed between MACD and price aligns with recent movements.

Volume Analysis

Volume spikes in mid-February coincide with the initial bullish move, indicating strong momentum.

A slight decrease in volume in recent sessions hints at a possible consolidation phase.

The volume spike suggests potential institutional buying interest during the bullish breakout.

Support & Resistance

Support is expected around $65.00, which previously acted as resistance.

Resistance is near $67.00, coinciding with recent highs.

Watching these levels is crucial for potential breakout or reversal signals.

Actionable Insights

Consider buying on dips near $65.00 support, especially if strong volume sustains.

Profit-taking could be appropriate near or above $67.00 unless momentum remains strong.

Stay cautious for any reversal below $65.00, which may signal a deeper correction.

The AI Technical Analysis Center is an informational tool only and does not constitute investment or trading advice.
This site is registered on wpml.org as a development site. Switch to a production site key to remove this banner.