Generic selectors
Exact matches only
Search in title
Search in content
Post Type Selectors

Popular stocks

Crypto

CFD

Currencies

Support

Gold

EUR/USD – Technical Analysis – 4h

March 2, 2026 08:02

Quick Summary

The asset chart shows clear bearish momentum over recent sessions. A series of lower highs and lows indicate persistent downward pressure, with key technical indicators confirming this trend.

The asset’s future looks cautious as bearish signals dominate the analysis. Investors should remain vigilant for any shifts in sentiment.

Candlestick Analysis

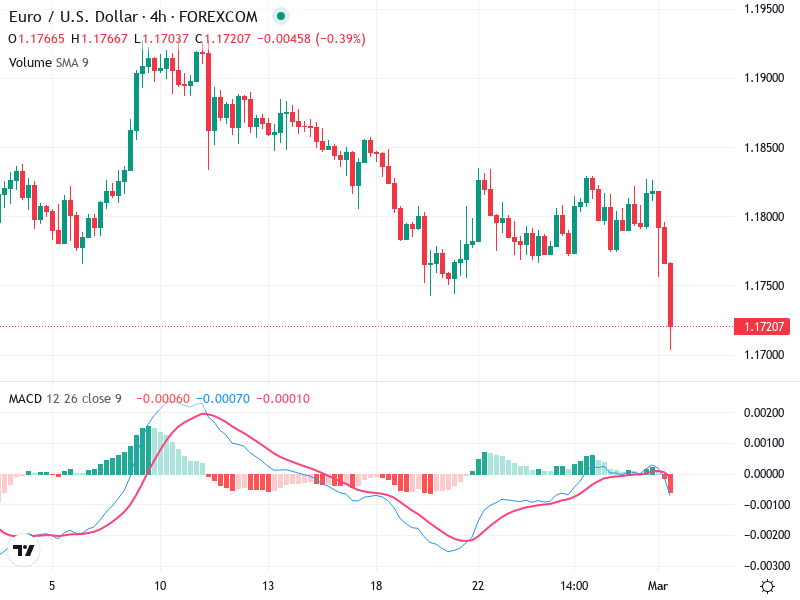
The overall trend is bearish, indicated by a series of lower highs and lower lows.

There's a strong bearish candlestick at the right end, suggesting a potential continuation of the downward trend.

The recent candlestick appears to break below previous support levels around 1.1750, indicating a breakout.

MACD Analysis

The MACD line (blue) has crossed below the Signal line (red), which is a bearish signal.

The histogram is increasing in the negative direction, reinforcing bearish momentum.

There are no significant divergences noted between the MACD and price action, confirming the downward pressure.

Volume Analysis

There's a noticeable spike in volume accompanying the recent bearish candlestick, often an indication of strong conviction behind the move.

The increased volume during a price decline suggests potential institutional selling.

This volume trend supports continuation of the bearish movement.

Support & Resistance

Immediate support is near 1.1700. If broken, the next level to watch would be closer to 1.1650.

Resistance is around the recently broken support zone of 1.1750 and could act as a barrier if prices attempt to retrace.

These levels are crucial for near-term price movements.

Actionable Insights

Consider a sell or hold strategy as the bearish momentum is strong.

However, it’s crucial to watch for any reversal patterns.

Watch for confirmation of the support break at 1.1700 and further bearish signals before committing to new positions.

The AI Technical Analysis Center is an informational tool only and does not constitute investment or trading advice.
This site is registered on wpml.org as a development site. Switch to a production site key to remove this banner.