Generic selectors
Exact matches only
Search in title
Search in content
Post Type Selectors

Popular stocks

Crypto

CFD

Currencies

Support

Gold

GBP/USD – Technical Analysis – 4h

March 2, 2026 13:04

Quick Summary

The GBP/USD 4-hour chart reveals key insights into market trends.

The asset is currently experiencing significant bearish momentum with potential reversal patterns emerging.

Monitoring critical support and resistance zones will be essential for decision-making.

Candlestick Analysis

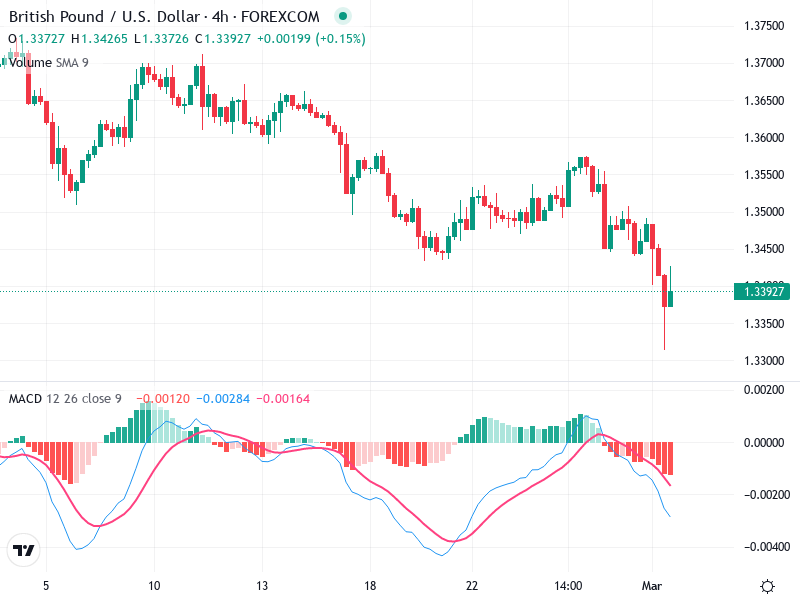
A notable pattern is observed with two long red candles followed by a hammer-like green candle suggesting a potential reversal. However, confirmation is needed.

The trend appears bearish, as evidenced by the series of lower highs and lower lows.

Recent sharp decline indicates a potential breakout below the previous support around 1.3400, now acting as a resistance.

MACD Analysis

The MACD line is below the Signal line, indicating bearish momentum. A previous bearish crossover is further confirmed by the decreasing MACD histogram.

The histogram is predominantly in negative territory, supporting the bearish momentum with no significant divergence seen yet.

No clear divergences between the MACD and price action are apparent currently.

Volume Analysis

A significant increase in volume accompanies the recent sharp price drop, suggesting strong bearish conviction.

The high volume on the red candles supports the downward move indicating possible institutional involvement.

The volume pattern emphasizes the importance of monitoring accompanying price movements closely.

Support & Resistance

Strong support appears around the 1.3300 region. A breach of this level could signal further declines.

1.3400 is the immediate resistance and a key zone to watch for potential reversal or continuation patterns.

The interaction with these levels will be critical in determining future price direction.

Actionable Insights

Short Position: Entering on retracements towards the 1.3400 resistance if price fails to break past this zone.

Watch for Reversals: A confirmed close above 1.3400 with high volume could indicate a reversal potential.

Confirmation of the hammer's bullish reversal is crucial before considering long positions. Look for a follow-up bullish candle above resistance levels.

The AI Technical Analysis Center is an informational tool only and does not constitute investment or trading advice.
This site is registered on wpml.org as a development site. Switch to a production site key to remove this banner.