Generic selectors
Exact matches only
Search in title
Search in content
Post Type Selectors

Popular stocks

Crypto

CFD

Currencies

Support

Gold

OIL – Technical Analysis – 4h

March 2, 2026 17:01

Quick Summary

The asset has shown dynamic movements recently, highlighted by significant price action near key levels. Understanding the technical indicators can provide insights into potential future trends.

Careful observation of candlestick patterns and volume can aid in crafting actionable trading strategies.

Candlestick Analysis

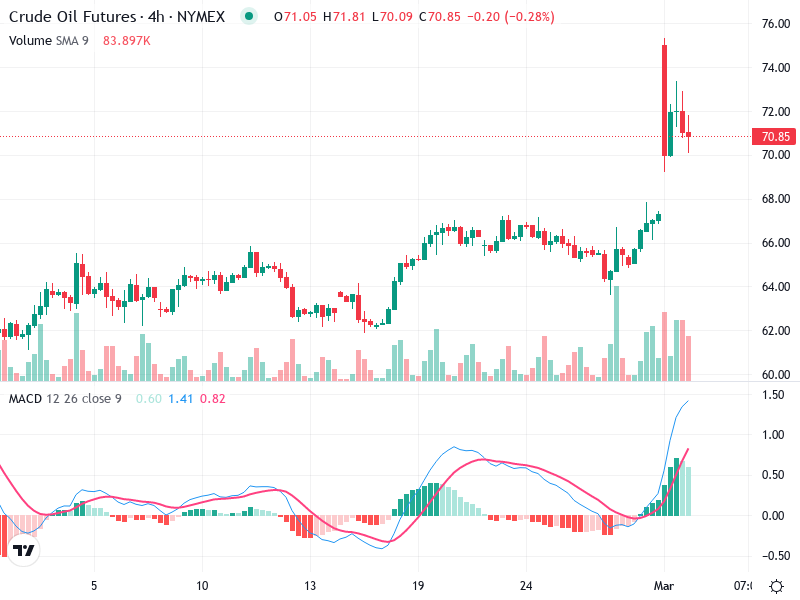
Recently, there appears to be a bearish engulfing pattern near the $74 level, indicating potential short-term reversal pressure after a strong upward move.

Prior to the reversal, the trend was bullish, evidenced by a series of higher highs and higher lows. The recent downturn could signify a correction or a new trend.

Around $68 and $70 acted as breakout zones in the recent bullish run. Current price action near $71 suggests it's testing whether it will hold or break down further.

MACD Analysis

The MACD line has crossed above the Signal line, indicating a bullish momentum, but there is a slight curvature suggesting declining momentum.

The histogram shows decreasing bullish momentum, aligning with the recent bearish candlestick pattern.

No clear divergences are apparent, which suggests alignment between price action and momentum indicators at this point.

Volume Analysis

Significant volume increased during the recent upward movement and subsequent reversal near $74, indicating possible institutional involvement or strong trader interest.

The decline in price with reducing volume might suggest a lack of strong sell pressure, but further volume analysis is required for confirmation.

This indicates potential for varying interpretations as more data on volume comes to light.

Support & Resistance

Key support is near $68, which was previously a resistance level now turned support.

The $74 level is a major resistance zone, reinforced by the recent bearish reversal pattern.

Understanding these levels can help strategize entry and exit points.

Actionable Insights

Consider buying if the price holds above $68 with confirmed bullish patterns or increased volume.

A break below $68 with strong volume could indicate further downside, suggesting sell or short positions.

Hold for now unless breakout confirmation above $74 or confirming reversal signals at support levels.

The AI Technical Analysis Center is an informational tool only and does not constitute investment or trading advice.
This site is registered on wpml.org as a development site. Switch to a production site key to remove this banner.