Generic selectors
Exact matches only
Search in title
Search in content
Post Type Selectors

Popular stocks

Crypto

CFD

Currencies

Support

Gold

GOLD – Technical Analysis – 4h

March 2, 2026 17:03

Quick Summary

The gold Futures chart indicates strong bullish momentum with recent high peaks observed. There is potential formation of a double top pattern, which may signify a reversal if it becomes confirmed. Traders should pay close attention to these patterns as they influence future market movements.

Candlestick Analysis

The chart displays a strong bullish trend with recent high peaks, although a potential double top formation could indicate a reversal if confirmed.

Overall, the trend remains bullish with recent upward momentum, although some pullbacks suggest possible consolidation.

A breakout was seen past the 5200 level, but recent pullback indicates consolidation nearer to 5310.

MACD Analysis

The MACD line is above the Signal line, indicating bullish momentum, though the decreasing gap suggests weakening momentum.

The histogram remains positive but is narrowing, which suggests slowing momentum and aligns with the pullback, warning of potential reversal.

No clear divergence observed, but vigilance is recommended due to narrowing histogram bars and decreasing MACD line difference.

Volume Analysis

Significant volume increase during the breakout above 5200 suggests strong interest, while recent higher volume during pullbacks might imply distribution.

The increased volume on pullbacks is a cautionary signal, possibly indicating a shift in market sentiment.

Unusual volume spikes suggest institutional activity, especially during the breakout and subsequent pullbacks.

Support & Resistance

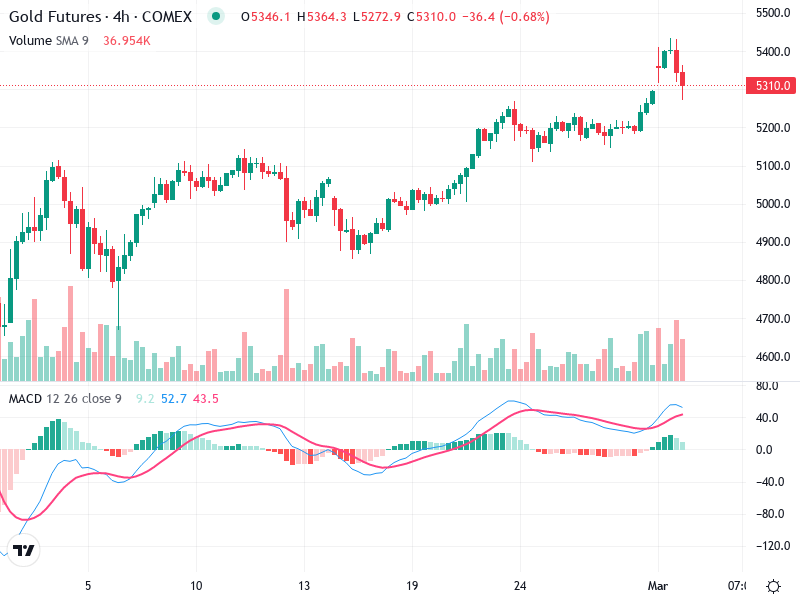
Key support is around 5200, marking where the recent breakout occurred, and should be watched closely.

Key resistance is near 5360, marking recent highs, potential double top formation, and acting as resistance.

Breaching these levels could signal significant moves, requiring confirmation through sustained volume.

Actionable Insights

Consider buying if the price breaks above 5360 with confirmation from increased volume.

Selling might be efficient if the price decisively breaks below 5200 support with strong volume, especially if MACD indicates a bearish crossover.

Holding is advisable within the current range, monitoring for definitive direction.

The AI Technical Analysis Center is an informational tool only and does not constitute investment or trading advice.
This site is registered on wpml.org as a development site. Switch to a production site key to remove this banner.