The AUD/USD chart currently exhibits bearish momentum supported by recent selling pressure. Monitoring key levels is essential for identifying potential turning points.
The asset has experienced significant selling, indicating possible further downside.
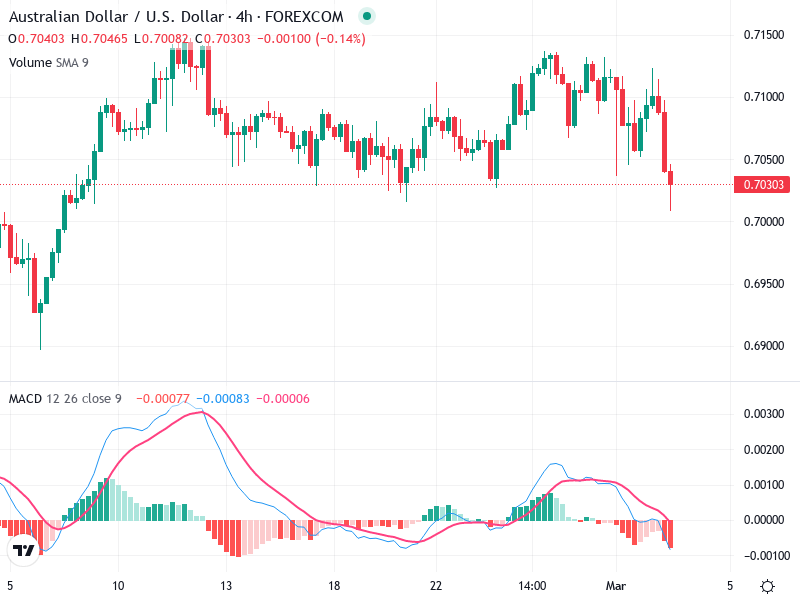
Candlestick Analysis
A long bearish candlestick has appeared, indicating strong selling pressure.
The overall trend seems sideways with recent bearish activity suggesting a potential downward move.
The current price is at a potential pullback zone after failing to break higher resistance levels decisively.
MACD Analysis
The MACD line is below the Signal line, indicating a bearish crossover.
The histogram is in negative territory, supporting the bearish momentum.
No significant divergences are noted between MACD and price action.
Volume Analysis
A noticeable spike in volume accompanied the recent drop, suggesting genuine selling interest.
The increased volume alongside price decrease supports the move.
The volume spike signals possible institutional selling.
Support & Resistance
Key support is around the 0.7000 level. A break below this could lead to deeper correction.
Resistance is noted around 0.7100, which has repeatedly acted as a ceiling.
The support and resistance levels are crucial for identifying potential reversals.
Actionable Insights
Consider a cautious approach to buying until clear signals of a reversal are observed.
Short positions may be considered, especially if support levels are conclusively breached.
Watch for reversal signals such as bullish candlestick formations near support.
The AI Technical Analysis Center is an informational tool only and does not constitute investment or trading advice.