Generic selectors
Exact matches only
Search in title
Search in content
Post Type Selectors

Popular stocks

Crypto

CFD

Currencies

Support

Gold

NGAS – Technical Analysis – 4h

March 3, 2026 17:04

Quick Summary

The asset is currently experiencing a bullish trend with notable developments in technical indicators.

A recent breakout and increased volume highlight market interest.

Monitoring key support and resistance levels will be crucial.

Candlestick Analysis

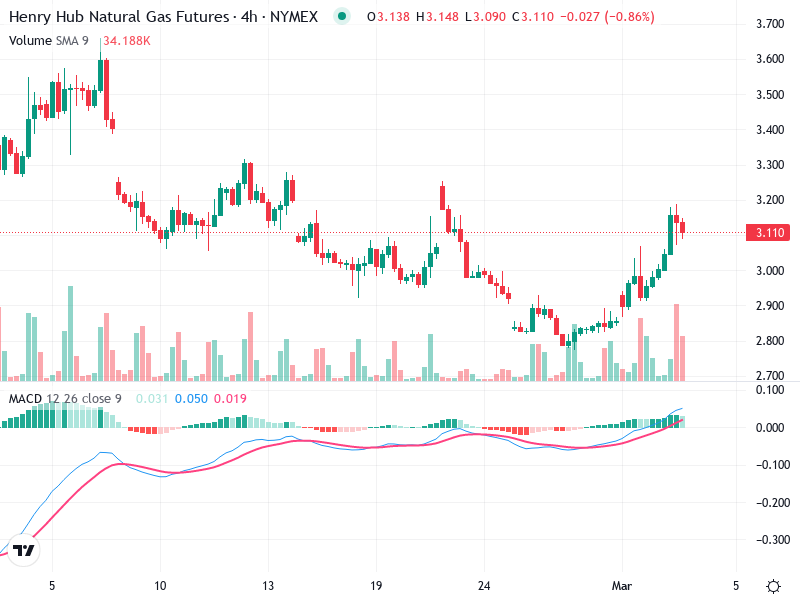
A notable pattern is the bullish candlestick formation around the beginning of March, indicating a potential reversal or continuation of a bullish trend.

The trend is showing bullish movement recently, but the slight pullback in the last candle could suggest a possible pause or correction.

There appeared to be a breakout above the previous resistance level around 3.00, with the price currently pulling back from a recent high.

MACD Analysis

The MACD line is above the Signal line, which is indicative of a bullish momentum, though the lines are converging slightly.

The histogram shows decreasing bullish momentum, suggesting a potential weakening in the current uptrend.

No clear divergences between the MACD and the price action are evident.

Volume Analysis

There is an increase in volume during the recent price rise, which often supports the bullish move.

The high volume on up days aligns with the price increase, reinforcing the bullish sentiment.

Slight spikes in volume can be seen, which may indicate significant market interest or institutional activity.

Support & Resistance

Key support is around 3.00, which was a recent breakout level and might provide support during a pullback.

Key resistance is near 3.20, which is the recent high where the price started pulling back.

Monitoring these levels will be important for future price movements.

Actionable Insights

Consider a hold or watch closely for signs of a continued bullish trend if the price sustains above 3.00.

Look for confirmation of support at the 3.00 level or a breakout above 3.20 for potential entry points.

A bearish crossover in the MACD or a fall below the 3.00 support could suggest a reversal or stronger pullback.

The AI Technical Analysis Center is an informational tool only and does not constitute investment or trading advice.
This site is registered on wpml.org as a development site. Switch to a production site key to remove this banner.