Generic selectors
Exact matches only
Search in title
Search in content
Post Type Selectors

Popular stocks

Crypto

CFD

Currencies

Support

Gold

AUD/USD – Technical Analysis – 4h

March 4, 2026 13:02

Quick Summary

The AUD/USD chart presents a compelling narrative of a potential reversal. Significant patterns indicate that recent price actions could signal a trend shift.

The asset exhibits interesting dynamics with key support and resistance levels in sight.

Candlestick Analysis

Recently, there's a noticeable bullish engulfing pattern, suggesting a potential reversal from the recent downward trend.

A hammer candlestick also appears at a recent low, which can indicate a bullish reversal.

The chart shows a recent downward move that may be attempting to reverse given the recent candlestick formations.

MACD Analysis

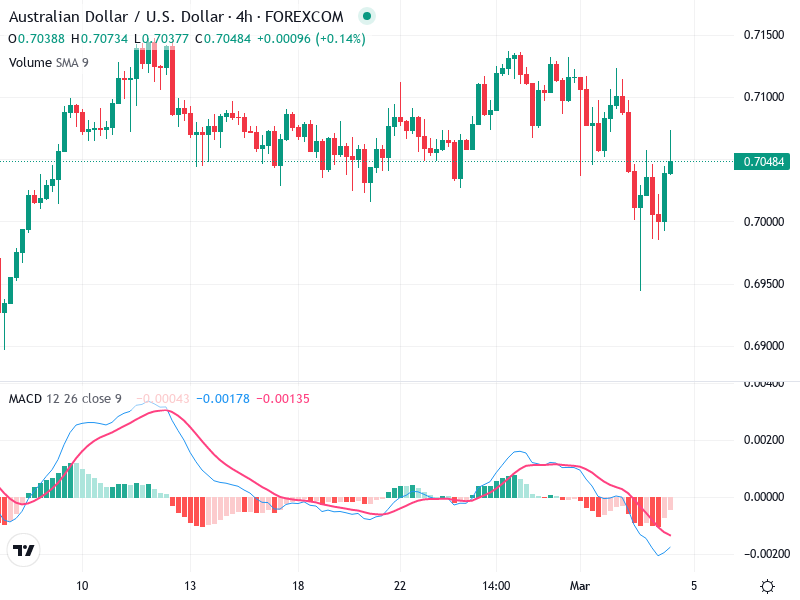
The MACD line is below the signal line, showing a bearish convergence. However, the lines seem to be converging, potentially indicating a crossover soon.

The histogram is negative but showing signs of shrinking momentum, which could indicate a weakening of downward pressure.

No clear divergence between MACD and price action is currently visible.

Volume Analysis

There is a moderate increase in volume in the recent bullish move, which supports the potential reversal indicated by the candlestick patterns.

The absence of large volume spikes suggests limited institutional intervention; instead, the volume seems consistent with retail trading patterns.

Support & Resistance

Key support is identified around 0.7000 where earlier buying interest was significant.

Resistance is expected near 0.7100, a previous high where price struggled to break through.

Watch for a breakout or a strong pullback around these levels.

Actionable Insights

Consider buying if a bullish MACD crossover confirms the candlestick reversal, especially if the price maintains above the 0.7000 level.

Selling could be considered if the price fails to hold above 0.7000 or if the MACD histogram shows expanding negative momentum again.

A hold might be advisable until clearer confirmation from MACD or a confirmed breakout occurs.

The AI Technical Analysis Center is an informational tool only and does not constitute investment or trading advice.
This site is registered on wpml.org as a development site. Switch to a production site key to remove this banner.