Generic selectors
Exact matches only
Search in title
Search in content
Post Type Selectors

Popular stocks

Crypto

CFD

Currencies

Support

Gold

NGAS – Technical Analysis – 4h

March 5, 2026 17:05

Quick Summary

The chart for Henry Hub Natural Gas Futures highlights key support and resistance levels that could guide trading strategies. The asset shows a sideways trend with slight bearish tendencies, suggesting potential shifts in market sentiment.

Observations of volume spikes and MACD patterns offer further insights into possible price movements.

Candlestick Analysis

The overall trend is sideways with a slight bearish tilt, highlighted by a decline from the 3.100 level.

There is a mix of candlesticks without dominant patterns like bullish engulfing or doji, indicating a sideways trend.

The 3.000 level acts as resistance and 2.900 as support, with higher tails suggesting buying interest at the support level.

MACD Analysis

The MACD line is slightly below the Signal line, indicating a weak bearish crossover and bearish sentiment.

The MACD histogram shows mild negative divergence, reinforcing the bearish sentiment but not strongly.

There's no clear divergence between MACD and price action, supporting the sideways movement.

Volume Analysis

An increase in volume during the recent price drop indicates potential selling pressure.

The decline in prices on higher volume supports the bearish trend.

An unusual spike in volume near the middle of the chart suggests possible institutional activity linked to price drops.

Support & Resistance

Resistance is approximately at 3.000, with multiple tests and no successful breakout, confirmed by candlestick tops.

Support is around 2.900, observed by previous bounces, indicating a level for potential reversals or sideways action.

Monitoring these levels for breakouts or breakdowns could provide trading signals.

Actionable Insights

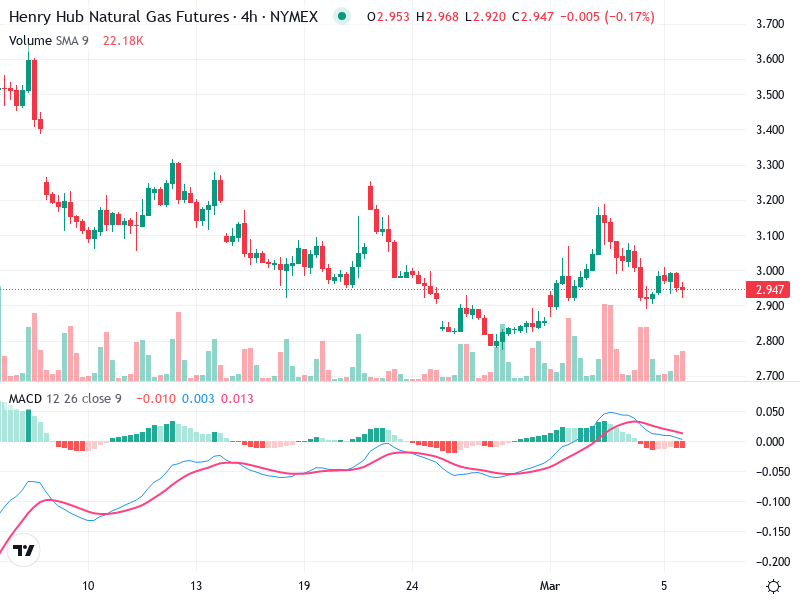
Consider entering a buy strategy only above the 3.000 level with a bullish breakout backed by increased volume.

A sell strategy could involve breaking below 2.900 with volume increase, suggesting further downside.

Hold positions unless a clear breakout or breakdown occurs, supported by volume and MACD confirmations.

Observe volume changes near support/resistance for breakout signs.

The AI Technical Analysis Center is an informational tool only and does not constitute investment or trading advice.
This site is registered on wpml.org as a development site. Switch to a production site key to remove this banner.