Generic selectors
Exact matches only
Search in title
Search in content
Post Type Selectors

Popular stocks

Crypto

CFD

Currencies

Support

Gold

NSDQ – Technical Analysis – 4h

March 6, 2026 08:01

Quick Summary

The NASDAQ 100 Index chart reveals intriguing patterns across technical indicators. Recent candlestick formations, alongside MACD and volume behavior, suggest pivotal market signals. Support and resistance levels play crucial roles in understanding upcoming price movements.

Candlestick Analysis

The recent candlesticks show a mix of bullish and bearish patterns with no clear dominant pattern.

Notable is a bullish engulfing pattern near the middle of the range, indicating a potential reversal from a short-term downtrend.

The overall trend appears sideways within the range of 24400 to 25600.

MACD Analysis

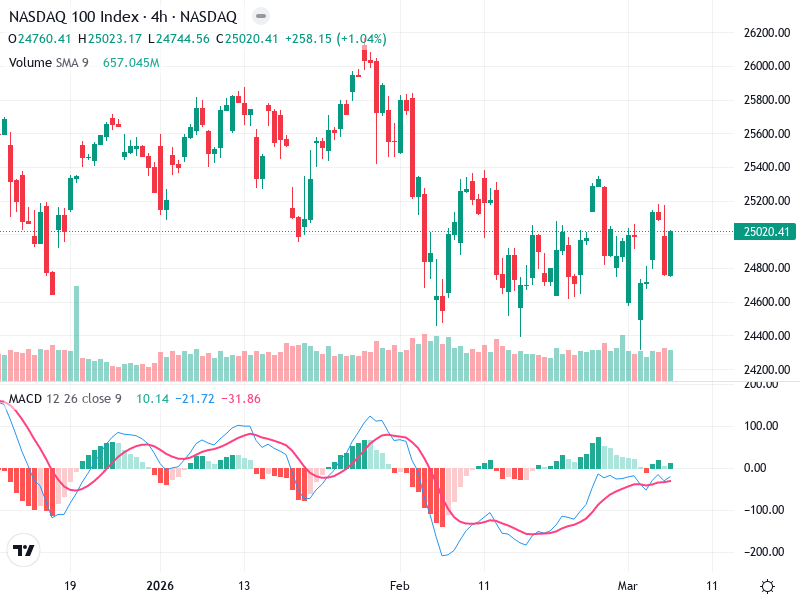
The MACD line is slightly crossing above the Signal line, suggesting a potential bullish crossover.

The histogram shows a decreasing bearish momentum, aligning with the potential bullish crossover, indicating a possible upward momentum.

There is no significant divergence observed between MACD and price action.

Volume Analysis

Volume is relatively stable, with no major spikes. A slight increase in volume supports the recent upward price movement.

The current volume trend supports the stability in the price action, with no significant institutional activity indicated.

No unusual spikes in volume are present to suggest strong buying or selling pressure.

Support & Resistance

Support: 24400. This level has been tested multiple times and appears significant.

Resistance: 25600. This level has also been tested several times, forming a resistance zone.

A break above 25600 with high volume could indicate a strong buying interest.

Actionable Insights

Buy on a confirmed breakout above 25600 with increased volume.

Sell if price breaks below 24400, indicating a bearish trend continuation.

Hold within the current range, especially if monitoring for breakout confirmation.

The AI Technical Analysis Center is an informational tool only and does not constitute investment or trading advice.
This site is registered on wpml.org as a development site. Switch to a production site key to remove this banner.