Generic selectors
Exact matches only
Search in title
Search in content
Post Type Selectors

Popular stocks

Crypto

CFD

Currencies

Support

Gold

GBP/USD – Technical Analysis – 4h

March 6, 2026 13:04

Quick Summary

The GBP/USD chart reveals a bearish trend over the past weeks, characterized by a consolidation phase that signals potential volatility. The asset has encountered a support level that could influence future price movements.

Close attention to economic news could impact the ongoing technical patterns of this currency pair.

Candlestick Analysis

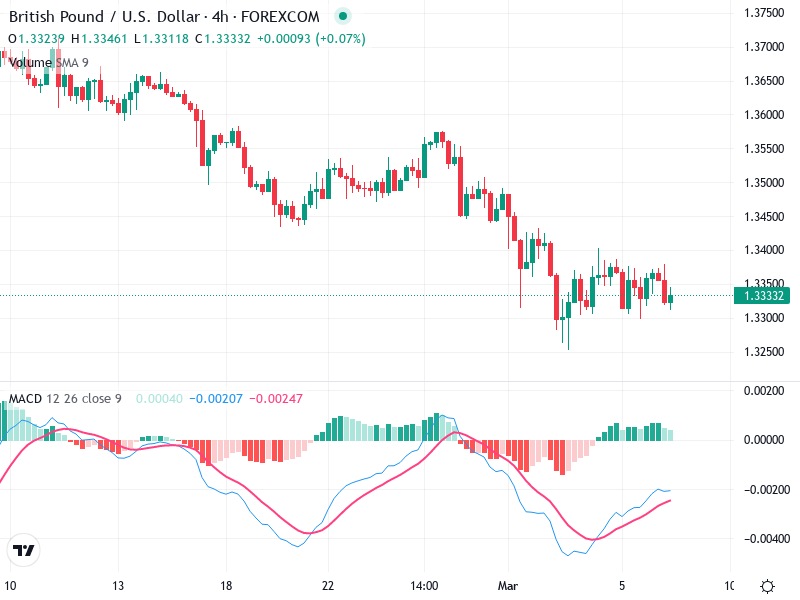
The chart displays an overall bearish trend, with a noticeable decline from mid-February to early March.

There are several small-bodied candles with wicks, indicating indecision and a possible consolidation or pause in the trend.

A potential breakout zone is around the 1.3350 level, with support around 1.3300 showing some buying interest.

MACD Analysis

The MACD line is below the signal line but shows a convergence indicating a potential bullish crossover.

The histogram is turning towards the zero line, reflecting decreased bearish momentum.

There is no clear divergence between the MACD and price action, suggesting agreement with the current price trend.

Volume Analysis

Volume shows periodic spikes but lacks consistent high volume, indicating possible lower participation among traders.

The moderate volume does not strongly confirm price movements but does not contradict recent minor price stability.

No unusual spikes are observed that would suggest strong institutional activity currently.

Support & Resistance

Key support is identified around 1.3300, where recent low price points have been tested.

Resistance is seen at approximately 1.3350 and could act as a psychological and technical barrier.

Breaking above 1.3350 could suggest a short-term bullish reversal, while a drop below 1.3300 might reinforce the bearish trend.

Actionable Insights

Consider entering a bullish position upon a confirmed breakout above 1.3350 with increasing volume and a completed MACD crossover.

A potential sell entry can be considered if the price falls below the 1.3300 support with significant volume and bearish MACD confirmation.

Holding may be advisable for traders waiting for clearer signals of a breakout or trend continuation.

The AI Technical Analysis Center is an informational tool only and does not constitute investment or trading advice.
This site is registered on wpml.org as a development site. Switch to a production site key to remove this banner.