Generic selectors
Exact matches only
Search in title
Search in content
Post Type Selectors

Popular stocks

Crypto

CFD

Currencies

Support

Gold

EUR/USD – Technical Analysis – 4h

March 9, 2026 08:02

Quick Summary

The EUR/USD 4-hour chart reveals ongoing bearish momentum but indicates potential for a reversal. The price is approaching significant support levels, with market indicators showing mixed signals.

Traders should closely monitor for confirmation signals to make informed decisions.

Candlestick Analysis

Recently, a possible bullish reversal pattern can be observed, such as a hammer, indicating potential buying interest after a prior downtrend.

The prevailing trend appears to be bearish, although there are signs of a potential reversal or consolidation phase.

The recent decline brought the price near 1.1500, a psychological level which seems to have acted as a support.

MACD Analysis

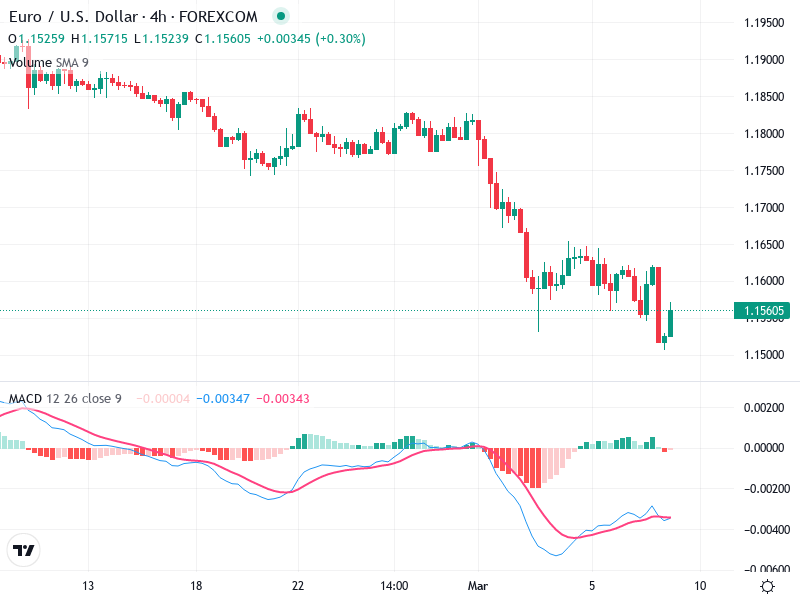
The MACD line is close to the signal line below the zero level, suggesting that bearish momentum is ongoing, but a potential crossover could indicate a shift towards bullishness.

The histogram shows diminishing bearish momentum, suggesting a weakening in selling pressure.

There is no clear divergence between MACD and price action, but the histogram indicates decreasing bearish momentum, implying a possible change in trend.

Volume Analysis

Slight uptick in volume accompanies the recent upward move, indicating some buying interest.

Volume supports the recent minor upward price movement, lending credibility to a potential short-term reversal.

No outstanding volume spikes indicating institutional activity; moderate volume accompanies the price movements.

Support & Resistance

Key support level is observed around 1.1500.

Immediate resistance is around 1.1600; a breakout through this could pave the way for further upside.

Actionable Insights

Consider buying on confirmation of a breakout above the 1.1600 resistance level, supported by MACD crossover or increased volume.

If prices fail to break resistance and MACD shows sustained bearish signals, a sell strategy might be considered.

Holding might be wise until clearer directional movement, given the mixed signals.

The AI Technical Analysis Center is an informational tool only and does not constitute investment or trading advice.
This site is registered on wpml.org as a development site. Switch to a production site key to remove this banner.