Generic selectors
Exact matches only
Search in title
Search in content
Post Type Selectors

Popular stocks

Crypto

CFD

Currencies

Support

Gold

GOLD – Technical Analysis – 4h

March 10, 2026 17:02

Quick Summary

The recent technical analysis of the asset suggests that there is notable bullish momentum. Candlestick patterns, MACD indications, and volume analyses are aligning to support this upward trend.

The asset is experiencing a series of higher lows which is indicative of accumulation, and resistance breakouts may further propel the price.

Candlestick Analysis

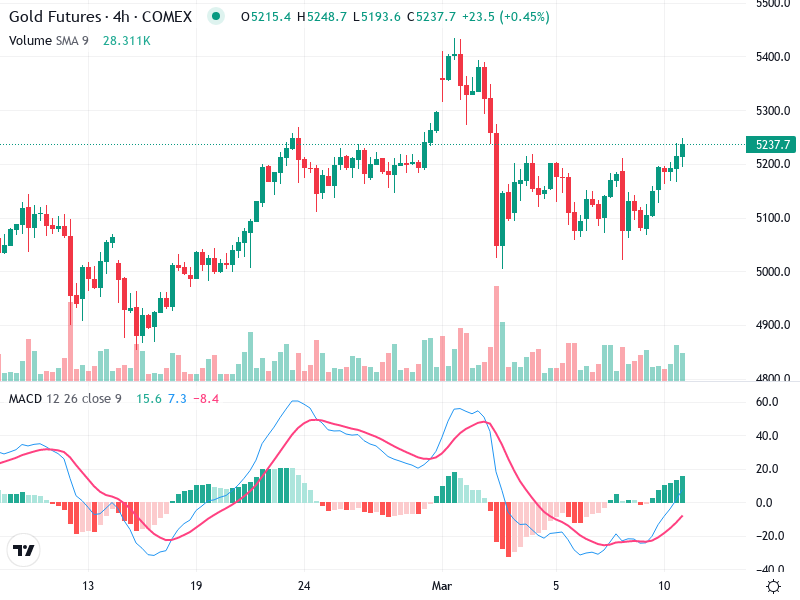
Significant Patterns: Recent candlestick formations suggest bullish momentum. There's no specific pattern like a bullish engulfing or hammer, but the uptrend in recent candles indicates buying interest.

Overall Trend: The current short-term trend appears bullish, as there is a series of higher lows forming a base near 5100, suggesting accumulation.

Breakout Zones: A breakout above the recent high around 5240 will confirm bullish strength, potentially driving prices past 5300.

MACD Analysis

Current State: The MACD line has crossed above the Signal line, indicating bullish momentum. This crossover supports the recent price increase.

Histogram: The MACD histogram is trending positively with increasing bars, signaling strengthening momentum.

Divergence: No significant MACD-price action divergence is evident, which aligns with the bullish move.

Volume Analysis

Significant Changes: An increase in volume accompanies the recent price rise, confirming the bullish sentiment.

Volume Support: Rising prices on higher volume indicates strong bullish participation, reducing the likelihood of a reversal in the immediate term.

Unusual Spikes: A visible spike in volume during the recent upswing suggests possible institutional activity.

Support & Resistance

Support Zones: Key support levels are observed around 5100, where previous lows and buying activity were concentrated.

Resistance Zones: Immediate resistance is seen near 5240. A break above this could lead to testing the 5300 level.

Actionable Insights

Buy Strategy: Consider a potential buy above 5240 on strong volume and confirmed breakout.

Sell Strategy: If unable to maintain above 5240, watch for a potential retracement to 5100 support.

Hold Strategy: Current holders might benefit from holding as the trend and indicators support further gains.

The AI Technical Analysis Center is an informational tool only and does not constitute investment or trading advice.
This site is registered on wpml.org as a development site. Switch to a production site key to remove this banner.