Generic selectors
Exact matches only
Search in title
Search in content
Post Type Selectors

Popular stocks

Crypto

CFD

Currencies

Support

Gold

NGAS – Technical Analysis – 4h

March 12, 2026 17:04

Quick Summary

The analysis focuses on the current technical setup of Henry Hub Natural Gas Futures.

The assessment reveals a cautiously bullish outlook while emphasizing volume activity and key levels.

Candlestick Analysis

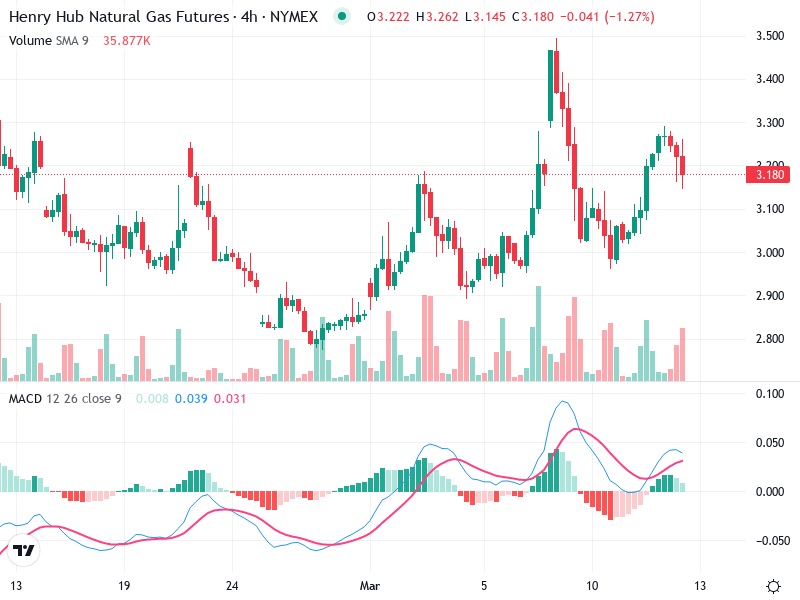
Significant patterns are evident, with bullish engulfing patterns appearing near lows, indicating potential upward reversals. A recent bearish candlestick with a long upper wick shows selling pressure.

The trend is short-term bullish, characterized by higher highs and higher lows, following initial consolidation.

A breakout above the 3.250 level indicated strong bullish sentiment, with a current pullback testing former resistance as potential support.

MACD Analysis

The MACD line is above the Signal line, indicating bullish momentum, though convergence suggests weakening momentum.

The MACD histogram shows decreasing positive values, implying a possible momentum shift.

No clear divergences between MACD and price action are presently observed.

Volume Analysis

A volume spike during the recent uptrend confirmed bullish price movement. Currently, volume appears to be decreasing during the pullback.

The prior upward movement was backed by increased volume, indicating genuine buying interest.

Unusual volume spikes during upward moves may hint at institutional activity.

Support & Resistance

Key support levels are around 3.100, where past resistance was overcome.

The next significant resistance is near the 3.3003.350 area, historically a zone where upward moves encountered selling pressure.

These levels are crucial for monitoring future price action.

Actionable Insights

Consider buying if the price holds above 3.100 support, with confirmation of increased volume and a bullish candlestick pattern.

Look for sell signals near the 3.300 resistance, especially with decreasing volume and bearish patterns.

Maintain holdings if the price consolidates above 3.250, awaiting clear breakout or breakdown signals with volume backing.

The AI Technical Analysis Center is an informational tool only and does not constitute investment or trading advice.
This site is registered on wpml.org as a development site. Switch to a production site key to remove this banner.