Generic selectors
Exact matches only
Search in title
Search in content
Post Type Selectors

Popular stocks

Crypto

CFD

Currencies

Support

Gold

OIL – Technical Analysis – 4h

March 13, 2026 17:00

Quick Summary

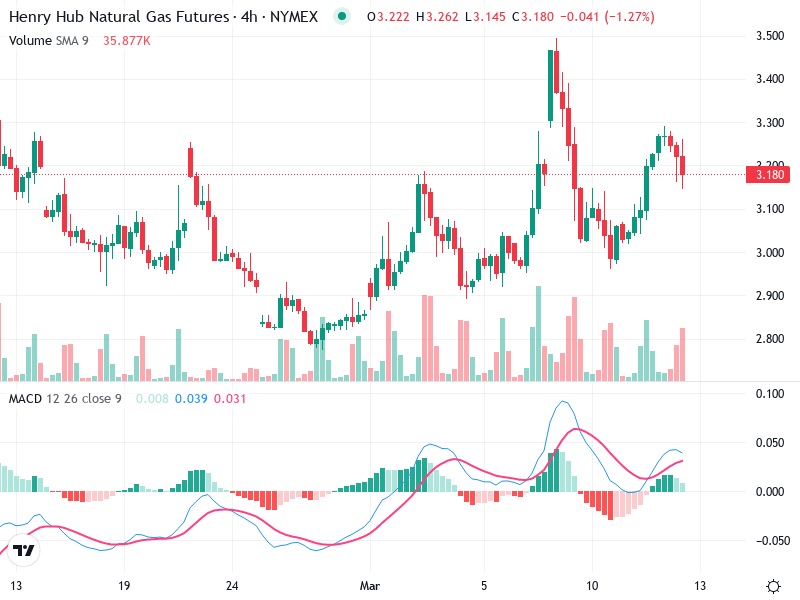
The chart exhibits a notable bullish trend, characterized by higher highs and higher lows leading to a recent peak.

With significant interest from buyers, patterns suggest profit-taking after strong buying activity. Key levels, like support and resistance, are being closely monitored.

The MACD and volume insights coincide with these movements, providing further clarity on the potential price trajectory.

Candlestick Analysis

The overall trend appears bullish, with a series of higher highs and higher lows leading up to the recent peak.

There is a notable large bullish candlestick followed by a pullback, suggesting a strong buying interest followed by some profit-taking.

The area around 90 appears to be a pullback zone after the sharp upward move, with current prices retesting previous resistance levels at around 100.

MACD Analysis

The MACD line is above the Signal line, indicating bullish momentum, although they are starting to converge slightly, suggesting a potential slowdown in upward momentum.

The histogram is positive but decreasing, showing that while upward momentum remains, it is weakening.

No clear divergences between MACD and price action at this point.

Volume Analysis

Significant volume increase coincided with the bullish breakout, supporting the move higher.

A slight decrease in volume during the pullback indicates reduced selling pressure.

Large volume spike during the peak suggests potential institutional activity or significant buying interest.

Support & Resistance

Support around 90, aligning with previous resistance turned support.

Resistance near 100, which is being tested currently.

A breakout above this level with volume could signal further upside potential.

Actionable Insights

Consider entering on a confirmed breakout above 100 with strong volume, targeting higher levels.

Caution on holding if prices fall below the 90 support level with increased volume, indicating a potential reversal.

Maintain positions if prices stay above 90 with stabilized volume and bullish MACD signals.

The AI Technical Analysis Center is an informational tool only and does not constitute investment or trading advice.
This site is registered on wpml.org as a development site. Switch to a production site key to remove this banner.