Generic selectors
Exact matches only
Search in title
Search in content
Post Type Selectors

Popular stocks

Crypto

CFD

Currencies

Support

Gold

AUD/USD – Technical Analysis – 1D

August 20, 2025 07:40

Quick Summary

The chart for shows varied technical indicators suggesting potential market movements. Recent analyses highlight the critical points and patterns of interest.

Traders should observe both the candlestick patterns and volume changes as they indicate market sentiment and momentum. The chart presents opportunities for both bullish and bearish scenarios.

Candlestick Analysis

Recent candlesticks display a mixture of patterns, pointing towards indecision among traders, evidenced by small-bodied candles.

The trend has seen a sideways movement with a slight bearish tilt, as prices have struggled to revisit previous highs and are now probing lower levels.

The price nearing the 0.6400 range marks a pivotal support area, with a potential breakout below this level indicating further downside movement.

MACD Analysis

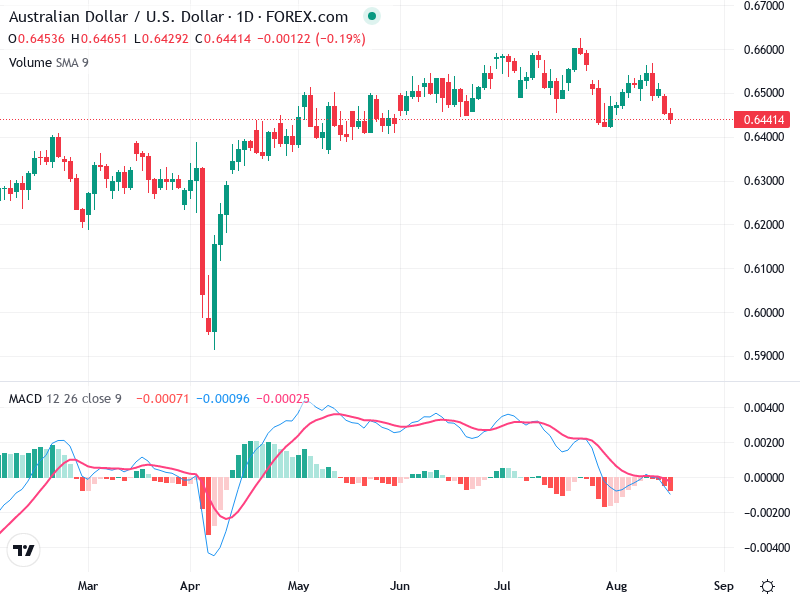
The MACD line being underneath the Signal line indicates a bearish crossover, suggesting declining momentum.

Negative histogram values reinforce the bearish outlook, although the recent stabilization suggests momentum may be steadying, albeit weakly.

Currently, there is no visible divergence between the MACD and price action, which points to a lack of significant directional shifts.

Volume Analysis

Volume has remained consistent without substantial upsurges, which could imply a lack of aggressive institutional moves at the moment.

The correlation between volume and price is not showcasing a definitive directional move; however, a volume spike during a breakout would reinforce the price action.

No unusual volume spikes have been observed in the present chart, but monitoring is advised as prices approach key support or resistance zones.

Support & Resistance

Significant support is located around the 0.6400 mark, recognized historically for providing support.

The resistance level lies near 0.6600, and surpassing this would hint at a possible shift in the market's sentiment.

These levels are crucial in gauging the next moves in the market, serving as indicators for action or caution.

Actionable Insights

Existing positions should be held cautiously; short positions are viable if the price confirms a break below the 0.6400 support.

Key near-term action includes watching for a breakout below 0.6400 with increased volume as a potential selling signal, or a bullish reversal pattern at this support for buy considerations.

Traders should beware of false breakouts leading to quick market reversals, emphasizing the need for patience and confirmation before committing to a trade.

The AI Technical Analysis Center is an informational tool only and does not constitute investment or trading advice.
This site is registered on wpml.org as a development site. Switch to a production site key to remove this banner.