Generic selectors
Exact matches only
Search in title
Search in content
Post Type Selectors

Popular stocks

Crypto

CFD

Currencies

Support

Gold

AUD/USD – Technical Analysis – 4h

January 22, 2026 13:03

Quick Summary

The asset is showing notable bullish momentum, marked by a strong uptrend. Key technical indicators support further upward potential. Given the current market conditions, this asset could provide lucrative opportunities for traders looking to capitalize on the bullish outlook.

Candlestick Analysis

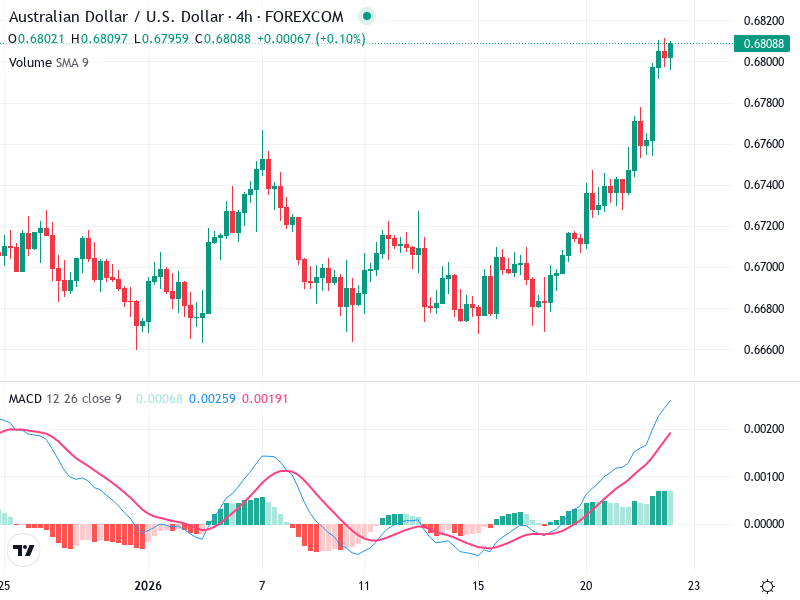
The chart shows a bullish trend with a series of higher highs and lower lows, especially notable in the recent uptrend.

Towards the end of the chart, there are multiple bullish candles, indicating strong buying pressure.

The price appears to break out above the previous resistance levels around 0.67800, validating the current uptrend.

MACD Analysis

The MACD line is above the Signal line, indicating a bullish crossover with momentum favoring further upward movement.

The MACD histogram shows increasing positive bars, suggesting strengthening bullish momentum.

There is no apparent divergence between the MACD and price action, supporting the bullish trend.

Volume Analysis

Volume appears to have increased alongside the recent price rise, indicating strong participation in the current move.

The rise in volume supports the bullish breakout, confirming the legitimacy of the uptrend.

There are no significant spikes indicating institutional activity beyond the general increase in volume.

Support & Resistance

The next significant resistance level may be around 0.68200, where the price is currently testing.

Key support is established at around 0.67400, where previous consolidations occurred.

Breaking above the current resistance level could lead to further upside, while dropping below support might indicate trend weakness.

Actionable Insights

Traders could look for buy opportunities on pullbacks to support levels around 0.67400, given the strong uptrend.

Current holders might continue to hold, watching for a break and close above 0.68200 for additional gains.

Selling may be considered if a reversal pattern appears or if MACD begins to show a bearish crossover.

The AI Technical Analysis Center is an informational tool only and does not constitute investment or trading advice.
This site is registered on wpml.org as a development site. Switch to a production site key to remove this banner.