Generic selectors
Exact matches only
Search in title
Search in content
Post Type Selectors

Popular stocks

Crypto

CFD

Currencies

Support

Gold

AUD/USD – Technical Analysis – 4h

January 26, 2026 13:03

Quick Summary

The chart for AUD/USD showcases a robust upward trend, marked by bullish candlestick formations. The asset has broken previous resistance levels, suggesting a potentially sustained rally.

With increasing volume corroborating the price move, the bullish momentum appears strong, unless disrupted by unforeseen market factors.

Candlestick Analysis

The chart shows a strong bullish trend with several consecutive green candlesticks, indicating strong upward momentum.

There are no reversal patterns like doji or bearish engulfing visible at the current levels.

The price has recently broken out above previous resistance levels around 0.6850, now acting as potential support.

MACD Analysis

The MACD line is above the Signal line, indicating bullish momentum.

The gap between the two lines is widening, suggesting increasing bullish sentiment.

The histogram is positive and expanding, which confirms strong bullish momentum.

Volume Analysis

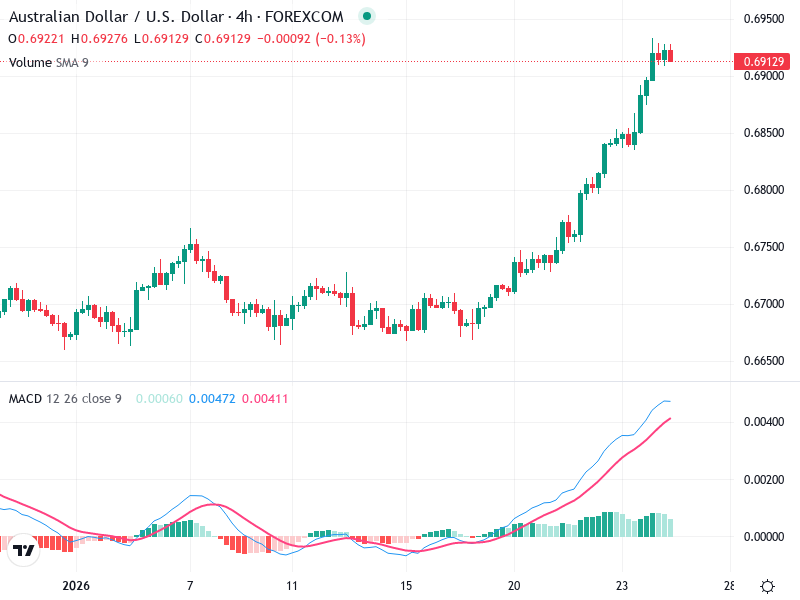
There is a noticeable increase in volume during the recent price advance, which supports the bullish breakout.

Rising prices accompanied by increasing volume confirm the strength of the current upward movement.

While volume has increased, it remains relatively stable, suggesting measured institutional activity rather than abrupt moves.

Support & Resistance

The recent breakout level around 0.6850 serves as a new support area.

The next potential resistance could be around 0.6950, the next psychological level.

Holding above 0.6850 is crucial for maintaining the upward momentum and looking for potential continuation towards 0.6950.

Actionable Insights

Consider buying on pullbacks near the new support level at 0.6850 with a target towards 0.6950.

Current holders could watch for further confirmations of strength as the price nears resistance.

If a reversal pattern forms near 0.6950, short-term traders might consider reducing exposure.

The AI Technical Analysis Center is an informational tool only and does not constitute investment or trading advice.
This site is registered on wpml.org as a development site. Switch to a production site key to remove this banner.