Generic selectors
Exact matches only
Search in title
Search in content
Post Type Selectors

Popular stocks

Crypto

CFD

Currencies

Support

Gold

AUD/USD – Technical Analysis – 4h

January 28, 2026 13:02

Quick Summary

The chart of the Australian Dollar/U.S. Dollar pair reveals a strong upward trend. Candlestick patterns and technical indicators suggest robustness in the asset’s performance. Traders should carefully observe key levels for possible entry and exit points.

Candlestick Analysis

The chart exhibits a strong bullish trend with consistent higher highs and higher lows.

Several bullish candlesticks are present, including a potential bullish engulfing pattern observed earlier in the uptrend.

The recent rise past the 0.69500 level could be seen as a breakout, and the current price stabilization above 0.7000 marks this as a new resistance turned support.

MACD Analysis

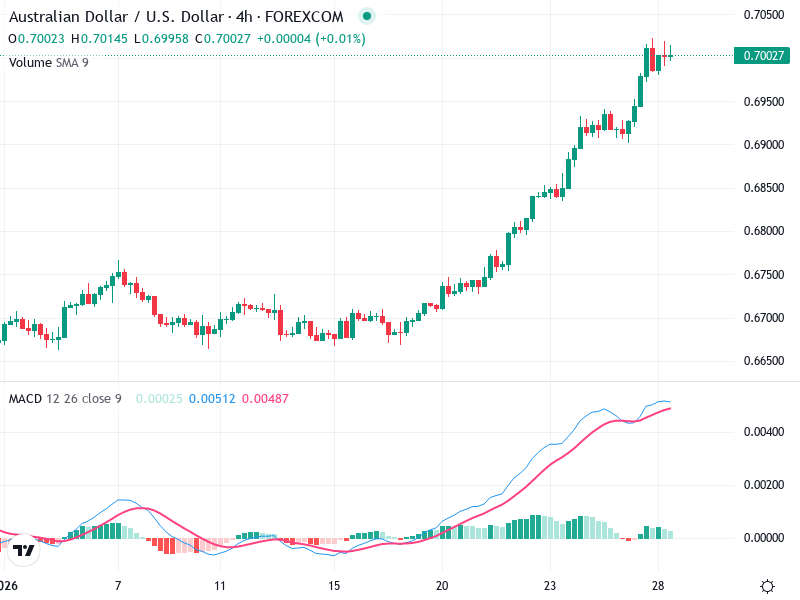
The MACD line is above the Signal line, indicating bullish momentum. There is no indication of a bearish crossover at this point.

The histogram shows positive bars, further confirming bullish momentum, although they are slightly narrowing, suggesting momentum might be tapering.

Currently, there is no divergence between MACD and price action, supporting the ongoing uptrend.

Volume Analysis

An increase in volume accompanied the recent price surge, supporting the upward movement, although volume now appears steady.

The volume supports the recent bullish breakout above 0.69500, validating the strength of the move.

No significant volume spikes suggest institutional activity is notable beyond the observed increase during the breakout.

Support & Resistance

0.69500 acts as a new support level.

0.70500 serves as potential resistance as there is a test of the upper levels.

These levels will be critical for determining any further bullish momentum or corrective pullbacks.

Actionable Insights

If bullish momentum continues and a confirmation above 0.70500 occurs, consider entering or adding to long positions.

Current holders can remain in the position, monitoring for any bearish divergence signals or volume drop-offs.

Watch for any bearish reversal patterns near the resistance zone or a bearish MACD crossover for potential sell signals.

The AI Technical Analysis Center is an informational tool only and does not constitute investment or trading advice.
This site is registered on wpml.org as a development site. Switch to a production site key to remove this banner.