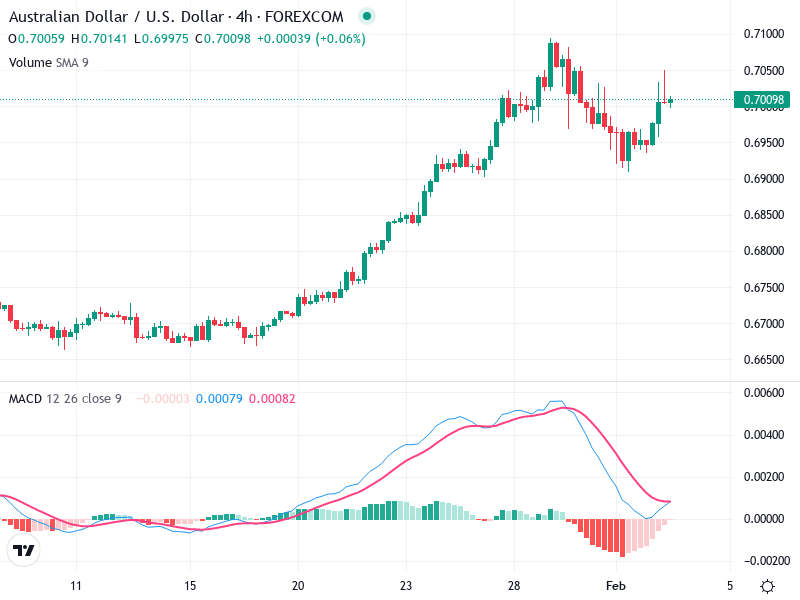
The 4-hour chart of AUD/USD reveals a promising outlook with potential bullish momentum. Recent patterns indicate an upswing, offering traders insight into possible future price movements. The analysis highlights key levels and indicators that suggest the current trend may continue.
Candlestick Analysis
A noticeable bullish candlestick followed by several small bodies suggests potential indecision.
A recent upswing with a bullish continuation is evident.
There was a significant breakout around the 0.6950 level.
MACD Analysis
The MACD line recently crossed above the Signal line, indicating potential bullish reversal.
The histogram shows decreasing red bars, transitioning towards zero.
No clear divergences are visible at this point.
Volume Analysis
There is a general alignment between rising price levels and volumes.
Recently, volume has been less pronounced, aligning with the consolidation phase.
A steady volume increase correlates with price rises.
Support & Resistance
Key support is around the 0.6950 level, a springboard for the recent bullish move.
The 0.7050 area appears as a resistance zone.
Breaking the 0.7050 resistance may signal further bullish continuation.
Actionable Insights
Consider long positions upon a confirmed break above 0.7050.
Watch for signs of weakness below 0.6950 for potential short opportunities.
Traders already long might consider holding above support levels.
The AI Technical Analysis Center is an informational tool only and does not constitute investment or trading advice.