Generic selectors
Exact matches only
Search in title
Search in content
Post Type Selectors

Popular stocks

Crypto

CFD

Currencies

Support

Gold

AUD/USD – Technical Analysis – 4h

February 5, 2026 13:03

Quick Summary

The chart of the asset reveals key market sentiments. Recent movements suggest potential shifts in market direction. Analyzing various indicators can provide a clearer picture of upcoming trends.

Candlestick Analysis

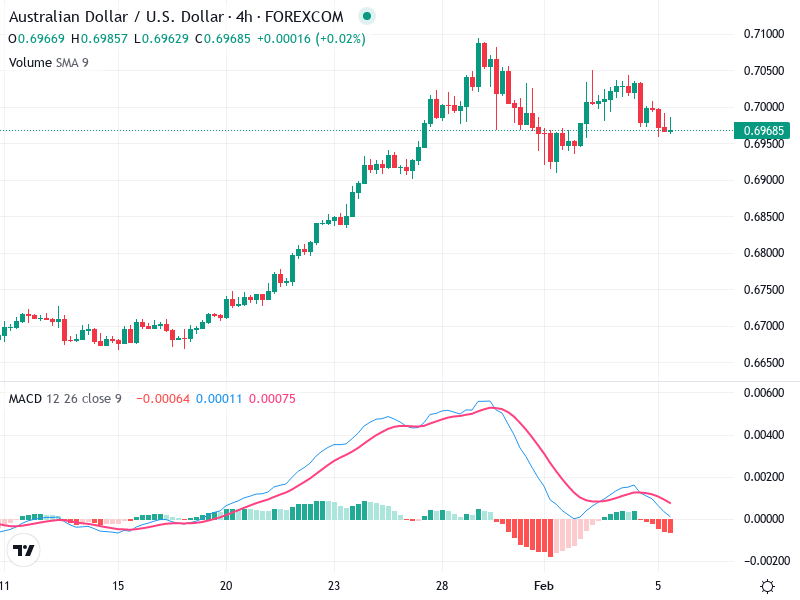
Recently, the chart shows a few bearish candlesticks after a series of bullish moves, indicating potential reversal or pullback.

There is a presence of doji and several smaller-bodied candles, suggesting indecision in the market.

The broader trend appears bullish, but there’s a short-term pullback or consolidation happening around the 0.7000 level.

MACD Analysis

The MACD line is below the Signal line, indicating a bearish crossover that happened recently.

The histogram is in negative territory and showing increasing red bars, indicating an increase in bearish momentum.

No significant divergence observed, but the momentum is shifting bearish with price action confirming the same.

Volume Analysis

There's a decrease in volume on the bullish candles recently, indicating weakening buying pressure.

Recent bearish moves have occurred on relatively lower volume, suggesting the pullback might not have strong conviction.

Noticeable volume spikes occurred recently, likely due to institutional activity, around the last peak.

Support & Resistance

0.7000 is a key resistance level, previously tested, creating a short-term top.

Around 0.6900 is a recent support level, holding up in previous pullbacks.

The price around 0.7000 seems to be acting as resistance with recent rejection at this level.

Actionable Insights

Consider buying if the price breaks above 0.7000 with confirming volume increase.

Selling could be considered if the price decisively breaks below 0.6900 or if bearish momentum continues to strengthen.

Holding is advisable until a clearer direction is established—watch for a further confirmation signal in MACD or a candlestick pattern near current support/resistance.

The AI Technical Analysis Center is an informational tool only and does not constitute investment or trading advice.
This site is registered on wpml.org as a development site. Switch to a production site key to remove this banner.