February 13, 2026 13:04
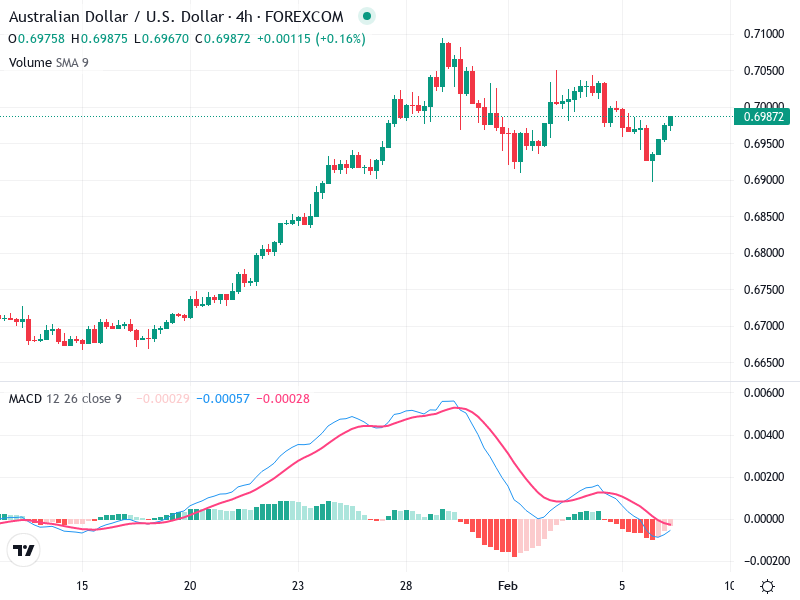
The AUD/USD chart is currently showing signs of a bullish recovery. After a notable pullback, there has been a series of green candlesticks indicating renewed buying interest. This suggests potential upward momentum in the near term.
Despite the previous downturn, recent technical indicators point to possible positive movement, making the asset an interesting watch for traders. Confirmation of key signals will be essential for establishing a clear direction.
The chart shows a recent bullish recovery with a series of green candlesticks after a notable pullback, indicating renewed buying interest.
Initially, the trend is upward, followed by a correction. The recent uptrend suggests a potential reversal to the upside.
The area around 0.6950 acted as a support zone, where the recent bounce occurred.
The MACD line is converging upwards toward the Signal line, indicating a potential bullish crossover in the near term.
The MACD histogram is narrowing, suggesting weakening bearish momentum and a possible shift toward bullish momentum.
There appears to be a slight bullish divergence where the price made a lower low while the MACD did not, indicating potential upward pressure.
There is a slight increase in volume accompanying the recent upward movement, supporting the price rise.
The rising volume during the upward movement suggests commitment from buyers.
No significant abnormal spikes in volume that suggest unusual activity.
Around 0.6950, where the recent bounce occurred.
The previous highs around 0.7050 could act as a resistance zone if the price continues to rise.
Consider a buy position if the bullish crossover in MACD confirms, targeting the resistance zone around 0.7050.
Look for confirmation of the bullish crossover in MACD and increased volume for further validation of the upward move.
A failure to break above the immediate resistance could lead to a retest of the support level.