February 17, 2026 08:03
The chart for suggests overall bullish tendencies in the current phase.
Momentum indicators align with price movement, hinting at further gains upon breakout confirmations.
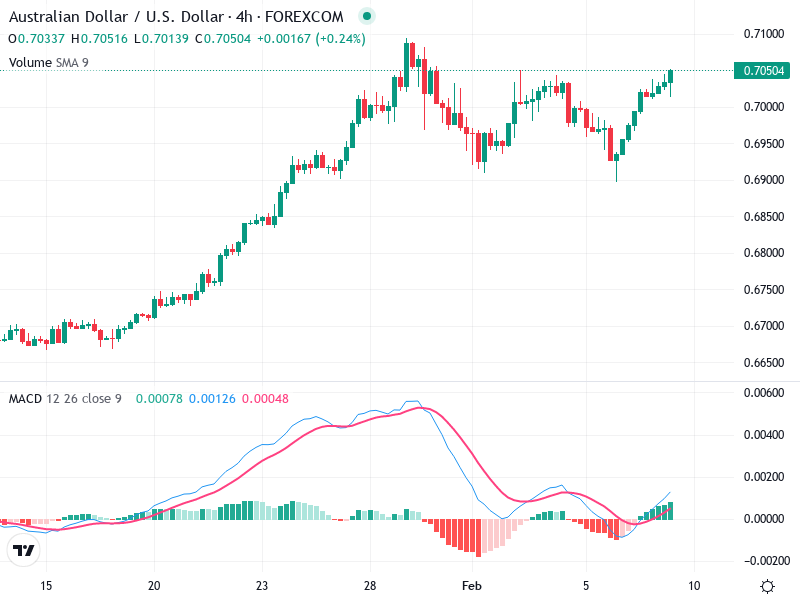
The chart demonstrates a clear bullish trend from mid-January to late January, followed by a period of consolidation and slight volatility with sharp pullbacks and recoveries.
There's a noticeable bullish engulfing pattern around the end of January, indicating a potential reversal from a slight bearish pullback.
The recent candles show a breakout above the 0.705 level, signaling bullish momentum continuation.
The MACD line has just crossed above the Signal line, indicating a bullish crossover.
The histogram is transitioning into positive territory, suggesting increasing bullish momentum.
No significant MACD-price divergence is observed, suggesting alignment between price action and momentum.
There is an increase in volume accompanying the recent upward price movement, supporting the bullish trend.
No extreme volume spikes suggest immediate institutional activity, but steady increase aligns with price rise.
The volume considerably supports the ongoing bullish narrative, weakening bearish counteractions.
Primary support is seen around the 0.695 level, previously tested during pullbacks.
The next key resistance lies around the 0.710 level, which might test the current bullish strength.
Traders should monitor these levels for indications of potential reversals or confirmations of trend continuation.
Consider buying on pullbacks near the 0.705 level with a stop loss slightly below recent lows to protect against false breakouts.
Monitor for bearish candlestick patterns or a MACD crossover bearish signal near the 0.710 resistance for potential short opportunities.
Maintain positions if above the 0.705 level, watching for continued volume support.