Generic selectors
Exact matches only
Search in title
Search in content
Post Type Selectors

Popular stocks

Crypto

CFD

Currencies

Support

Gold

AUD/USD – Technical Analysis – 4h

February 17, 2026 13:02

Quick Summary

The asset chart shows notable patterns and trends that could influence future price movements. Recent analysis indicates ongoing market dynamics that require close monitoring.

Traders should focus on key support and resistance levels for strategic decision-making.

Candlestick Analysis

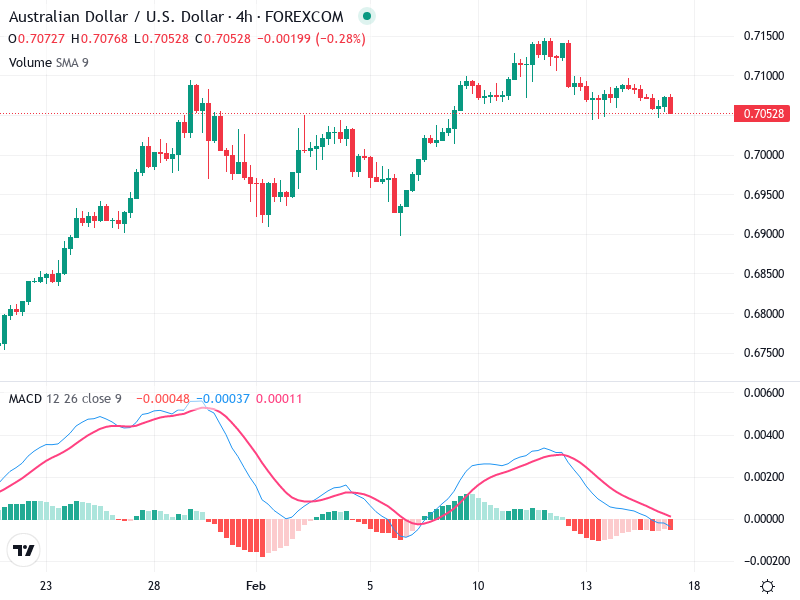
The overall trend appears to be bullish, with a strong upward movement followed by a consolidation phase.

Recent candlesticks show a series of small-bodied candles, indicating indecision or a potential reversal.

Resistance around the 0.71500 level was tested but not broken conclusively, while immediate support is observed near the 0.70000 level, providing a potential reversal point.

MACD Analysis

The MACD line is slightly below the Signal line, signifying bearish momentum.

A recent bearish crossover indicates weakening bullish sentiment, but the histogram is showing a decreasing bearish momentum, hinting at a shift or pause in the trend.

No clear divergences observed at this time, as both price and MACD are generally aligned.

Volume Analysis

Volume has been relatively stable, with no significant spikes that would suggest strong institutional activity.

This stability implies that the lack of volume increase on pullbacks may indicate weak selling pressure.

Monitoring volume changes is important to identify potential breakouts or further consolidations.

Support & Resistance

The 0.70000 level is a crucial support zone.

The 0.71500 level serves as an important resistance, with the potential for a strong breakout if surpassed.

The proximity of current price to support could trigger a reversal if buying pressure increases.

Actionable Insights

For those already holding positions, observe how the price reacts around the 0.70000 support.

Consider buying on a confirmed bullish reversal pattern near the support level.

If price breaks below the 0.70000 support with strong volume, it might be a signal to sell.

The AI Technical Analysis Center is an informational tool only and does not constitute investment or trading advice.
This site is registered on wpml.org as a development site. Switch to a production site key to remove this banner.