Generic selectors
Exact matches only
Search in title
Search in content
Post Type Selectors

Popular stocks

Crypto

CFD

Currencies

Support

Gold

AUD/USD – Technical Analysis – 4h

February 26, 2026 13:02

Quick Summary

The asset is currently undergoing an upward trend characterized by consistent bullish patterns. Recent price actions suggest strong momentum, supported by technical indicators. Traders should watch for confirmation of trend continuation.

Candlestick Analysis

The overall trend appears to be bullish in the short term as evidenced by the recent higher highs and higher lows.

There are no clear major reversal candlestick patterns, but the recent candlesticks show bullish characteristics with consecutive green candles.

A breakout is observed above the 0.7100 level which previously acted as resistance.

MACD Analysis

The MACD line is above the Signal line, suggesting a bullish crossover recently occurred which indicates potential upward momentum.

The histogram is positive and increasing, reflecting strengthening bullish momentum.

No significant divergence is observed between the MACD and the price. Both are in alignment indicating upward movement.

Volume Analysis

Volume has increased slightly during the recent bullish rise, supporting the upward price movement.

There are no unusual volume spikes that stand out significantly suggesting consistent trading activity without heavy institutional intervention.

This volume pattern signifies steady interest in continuation of the trend.

Support & Resistance

Key support is around the 0.7050 level which should hold if the uptrend continues.

Immediate resistance is near 0.7150, and breaking this level would suggest further bullish continuation.

Monitoring these levels can provide insights into potential price movements.

Actionable Insights

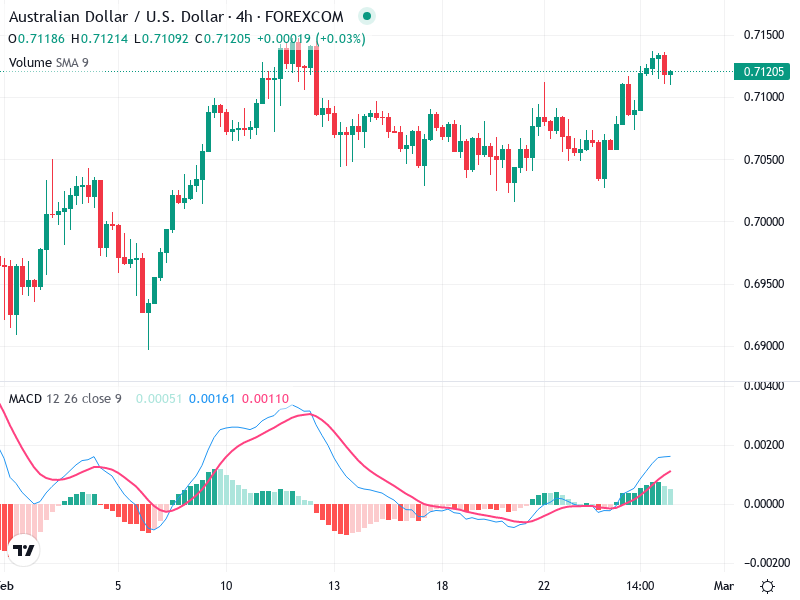
Consider buying on pullbacks near support levels, specifically around the 0.7100 to 0.7050 range, if bullish conditions are confirmed by price action.

Watch for potential selling pressure if the price fails to break the 0.7150 zone convincingly.

Current holders could maintain positions while monitoring for reversal signals near resistance.

The AI Technical Analysis Center is an informational tool only and does not constitute investment or trading advice.
This site is registered on wpml.org as a development site. Switch to a production site key to remove this banner.