Generic selectors
Exact matches only
Search in title
Search in content
Post Type Selectors

Popular stocks

Crypto

CFD

Currencies

Support

Gold

AUD/USD – Technical Analysis – 4h

September 9, 2025 07:07

Quick Summary

The AUD/USD 4-hour chart indicates a prevailing bullish trend.

Multiple technical indicators support upward momentum.

The asset price shows a positive movement driven by strong trends.

Candlestick Analysis

The chart shows an overall bullish trend starting from the middle of the chart.

A Bullish Engulfing Pattern is visible around late August, signaling a strong reversal from the downtrend.

The price has recently broken above the previous resistance level around 0.6580.

MACD Analysis

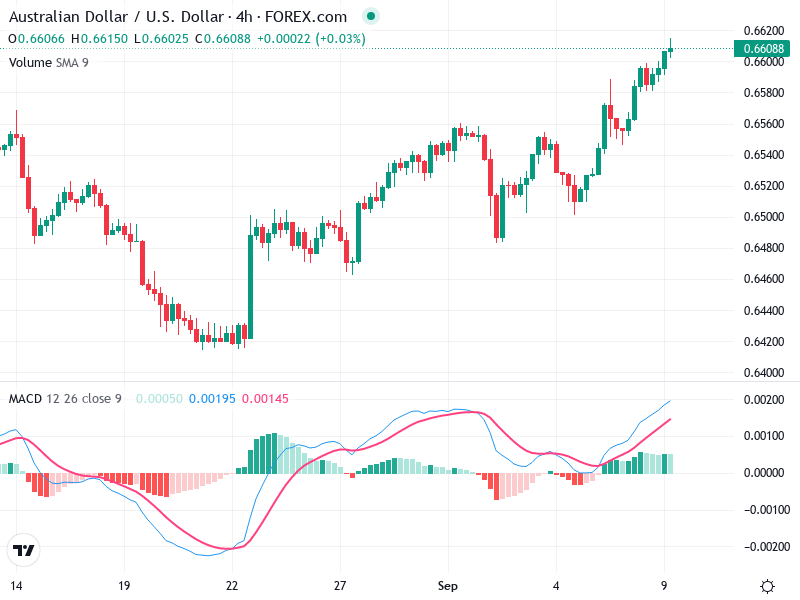
The MACD line is above the Signal line, showing a bullish crossover and indicating upward momentum.

The histogram is positive and increasing, suggesting strengthening momentum.

No significant divergence between the MACD and price action, confirming the trend strength.

Volume Analysis

Volume seems consistent with the price rise, supporting the bullish trend.

There are no unusual spikes in volume that would suggest sudden institutional buying or selling.

The volume trend reinforces the ongoing price movement.

Support & Resistance

Support is around 0.6540, acting as a key level after the breakout.

The next resistance might be around 0.6620, where the price could face selling pressure.

Monitoring these levels is essential for trading strategy adjustments.

Actionable Insights

Consider buying on dips above the 0.6540 support level with a target towards 0.6620 and beyond if volume increases.

If already long, monitor the 0.6540 support zone closely for any weaknesses.

Watch for any bearish candlestick patterns or MACD crossovers for potential short opportunities.

The AI Technical Analysis Center is an informational tool only and does not constitute investment or trading advice.
This site is registered on wpml.org as a development site. Switch to a production site key to remove this banner.