Generic selectors
Exact matches only
Search in title
Search in content
Post Type Selectors

Popular stocks

Crypto

CFD

Currencies

Support

Gold

AUD/USD – Technical Analysis – 4h

March 5, 2026 13:02

Quick Summary

The AUD/USD chart reveals crucial aspects influencing the currency pair. Recent observations indicate fluctuating movements within specific price ranges. Analyzing these patterns provides actionable insights for potential trading strategies.

Candlestick Analysis

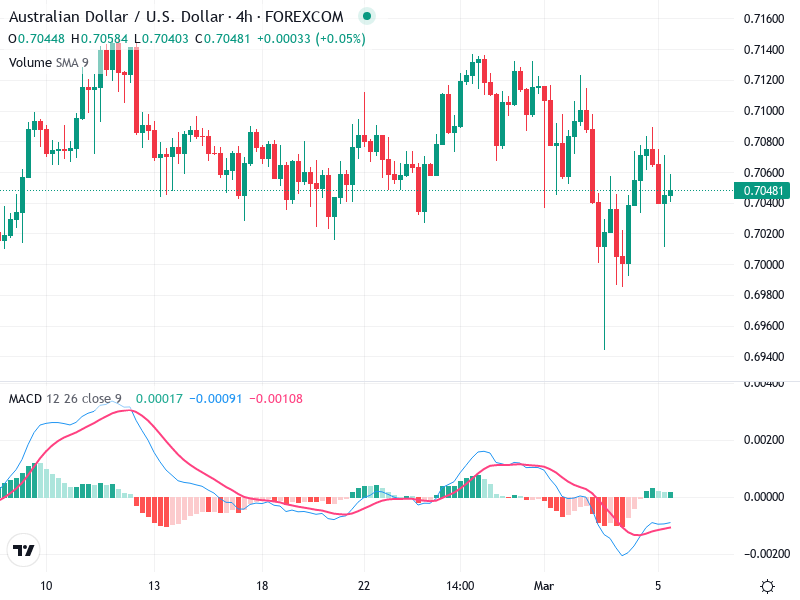
The chart shows several candlestick patterns, but a notable one is a potential bullish engulfing pattern formed after a recent dip around March 3. This might indicate a temporary exhaustion of selling pressure.

The current trend appears to be sideways with volatile price movements, as the price oscillates between approximately 0.6960 and 0.7120.

A breakout above 0.7120 could signal a shift to a bullish trend, while a drop below 0.6960 might confirm a bearish move.

MACD Analysis

The MACD line is crossing above the signal line, signaling a potential bullish reversal.

The histogram has shifted from negative to slightly positive, suggesting a change in momentum towards the upside.

There are no clear divergences between the MACD and price action currently evident.

Volume Analysis

There is a noticeable increase in volume during the recent price drop on March 3, followed by a decrease as the price stabilizes.

The higher volume during the price drop suggests strong selling pressure, which later lessened, aligning with the current consolidation phase.

The spike on March 3 could indicate potential institutional activity initiating the recent downturn.

Support & Resistance

Key support is around 0.6960, observed from previous rebounds.

Resistance lies near 0.7120, where prices have previously struggled to break through.

These levels are crucial for predicting potential reversals or confirming breakouts, suggesting possible areas for stop losses or target points.

Actionable Insights

Consider buying if the price breaks above 0.7120 with continued increasing volume and a strong MACD signal.

A breakdown below the 0.6960 support might be an opportunity for short selling, especially if supported by a bearish MACD crossover.

Traders may hold positions given the current sideways trend until a clear direction is established.

The AI Technical Analysis Center is an informational tool only and does not constitute investment or trading advice.
This site is registered on wpml.org as a development site. Switch to a production site key to remove this banner.