Generic selectors
Exact matches only
Search in title
Search in content
Post Type Selectors

Popular stocks

Crypto

CFD

Currencies

Support

Gold

AUD/USD – Technical Analysis – 4h

September 10, 2025 07:07

Quick Summary

The AUD/USD chart indicates a cautiously bullish sentiment. The technical analysis reveals that the asset is demonstrating strong upward momentum with several higher highs and higher lows.

However, traders should be aware of the lack of volume support which could affect the upward trend.

Candlestick Analysis

The chart does not show any classic patterns like bullish engulfing or doji but displays strong upward momentum with several higher highs and higher lows.

The recent candles show a consolidation near the current price.

The trend appears to be bullish as there is a series of higher highs and higher lows.

MACD Analysis

The MACD line is slightly above the Signal line, suggesting a recent bullish crossover.

The histogram bars are near the zero line, indicating weakening momentum. This suggests potential consolidation or a shallow pullback.

There are no obvious divergences between MACD and price action at the moment.

Volume Analysis

The volume is relatively stable with no major spikes, indicating that recent price movements are not supported by heavy institutional activity.

Low volume does not strongly support the bullish movement, which might lead to vulnerability in the upward trend.

No unusual spikes are currently evident.

Support & Resistance

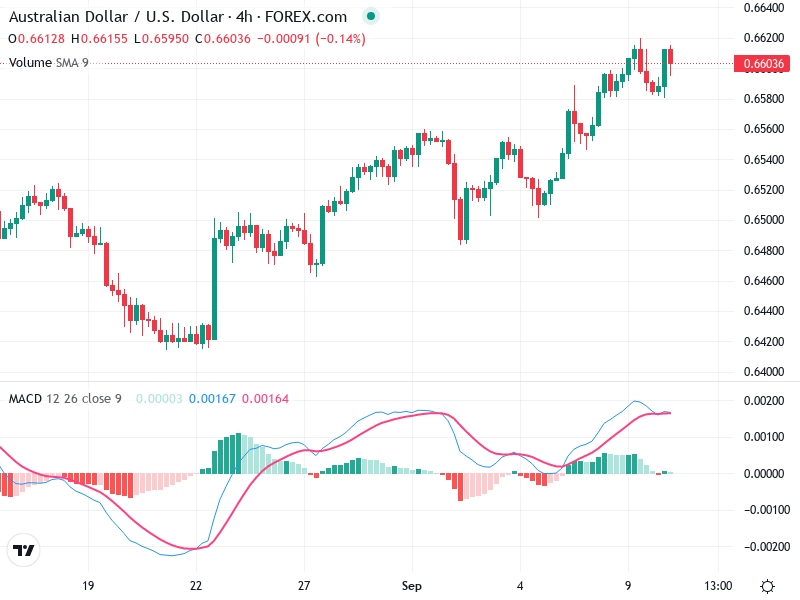
Support appears to be around the 0.6500 level, which aligns with recent lows.

A key resistance level is around 0.6620, where prices have recently faced difficulty.

The resistance zone is near the 0.6620 level, where prices have struggled to break through.

Actionable Insights

Consider a hold strategy for long positions unless a clear breakout above 0.6620 is observed.

Watch for volume increase as a confirmation of any breakout. A decline back towards the support could present buying opportunities if accompanied by a confirming candlestick pattern.

Watch for a bearish MACD crossover or increasing volume against the prevailing trend, which might signal a trend reversal.

The AI Technical Analysis Center is an informational tool only and does not constitute investment or trading advice.
This site is registered on wpml.org as a development site. Switch to a production site key to remove this banner.