Generic selectors
Exact matches only
Search in title
Search in content
Post Type Selectors

Popular stocks

Crypto

CFD

Currencies

Support

Gold

AUD/USD – Technical Analysis – 4h

September 15, 2025 07:08

Quick Summary

The asset is currently showing a bullish trend on the 4-hour chart.

The chart indicates potential for further upward movement if certain resistance levels are breached.

Overall technical indicators provide insight into market sentiment and potential future directions.

Candlestick Analysis

The overall trend on this 4-hour chart is bullish, with a clear pattern of higher highs and higher lows.

There is a potential bullish continuation pattern forming as recent candles continue to close higher.

The price is nearing resistance around 0.6670, indicating potential for a breakout if sustained buying pressure occurs.

MACD Analysis

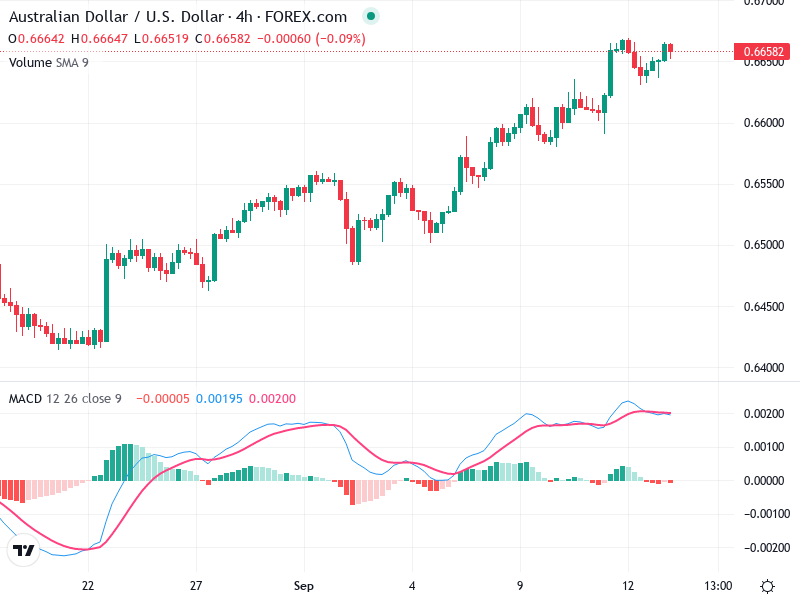
The MACD line is above the Signal line, illustrating bullish momentum, but they are converging, suggesting a potential pause or pullback.

The histogram is currently displaying small positive values, implying waning bullish momentum.

No significant divergence is observed between the MACD and price, which aligns with the current bullish trend.

Volume Analysis

Volume appears to have low variability, without significant spikes, which may suggest the move lacks strong institutional backing at the moment.

The steady volume supports the gradual upward price trend but lacks the spikes typically seen in strong breakout movements.

This volume pattern indicates that while the trend is upwards, caution should be taken regarding the lack of strong volume spikes.

Support & Resistance

Near 0.6670 is identified as a crucial resistance. A breakout above this level on increased volume could signal further bullish movement.

Immediate support is likely around 0.6600, which has held during prior pullbacks in the trend.

Monitoring these levels will be important for future price action predictions.

Actionable Insights

Consider buying on a confirmed breakout above 0.6670, ideally with increased volume, which would signal strong momentum.

Caution is advised if volume remains low, as it may indicate a false breakout.

If holding long positions, watch for a decrease in MACD momentum or a bearish crossover as a signal to reevaluate.

The AI Technical Analysis Center is an informational tool only and does not constitute investment or trading advice.
This site is registered on wpml.org as a development site. Switch to a production site key to remove this banner.