Generic selectors
Exact matches only
Search in title
Search in content
Post Type Selectors

Popular stocks

Crypto

CFD

Currencies

Support

Gold

AUD/USD – Technical Analysis – 4h

August 25, 2025 07:06

Quick Summary

The chart depicts a recent shift toward bullish momentum with a notable upward movement.

The breakout of previous resistance levels suggests a potential continuation of this trend.

Volume and MACD indicators further validate this optimistic outlook.

Candlestick Analysis

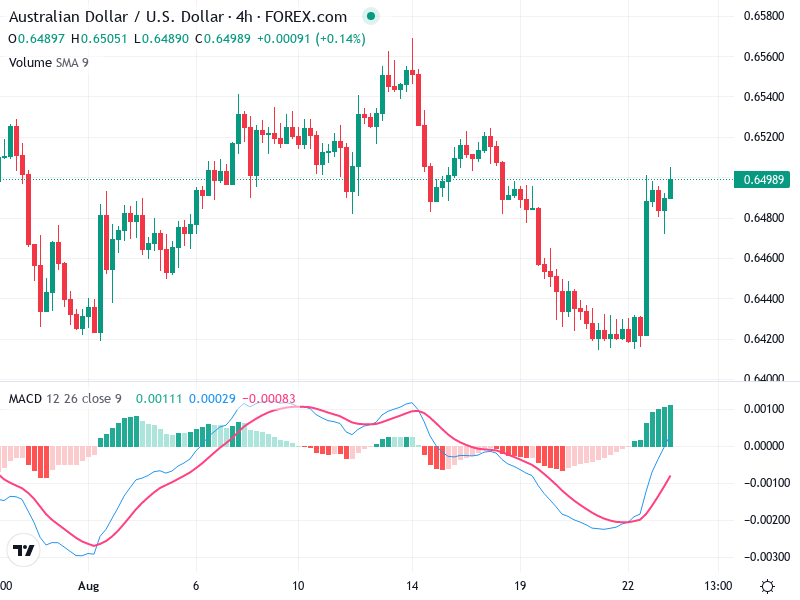
The chart shows a bullish engulfing pattern just before the recent rally, indicating a potential reversal from the previous downtrend.

Currently, the trend is turning bullish after a previous bearish period, highlighted by the recent strong green candlesticks.

A breakout is occurring above the 0.648 level, previously acting as a resistance zone.

MACD Analysis

There is a bullish crossover where the MACD line has crossed above the Signal line, suggesting increasing bullish momentum.

The histogram shows rising green bars, which confirms strong bullish momentum.

No significant divergence is visible currently, as price action and MACD suggest aligned bullish sentiment.

Volume Analysis

There is a noticeable increase in volume accompanying the recent upward price movement, affirming the strength of the bullish breakout.

The volume spike during the upward move supports the breakout, indicating significant buying interest.

The volume increase suggests possible institutional interest at the breakout point.

Support & Resistance

Key support is now at the recent breakout level around 0.648, where previous resistance may turn into strong support.

The next resistance level is near 0.652, where the price faced previous difficulty in August.

Observing how price reacts at these levels will be key in foretelling potential reversal or continuation patterns.

Actionable Insights

Consider buying, as the breakout and supporting volume indicate a strong bullish move. Watch for prices sustaining above the 0.648 level.

Caution advised at the 0.652 resistance; taking partial profits here could be strategic if bullish momentum falters.

For long-term positions already held, consider staying in, given the fresh bullish impetus.

The AI Technical Analysis Center is an informational tool only and does not constitute investment or trading advice.
This site is registered on wpml.org as a development site. Switch to a production site key to remove this banner.