Generic selectors
Exact matches only
Search in title
Search in content
Post Type Selectors

Popular stocks

Crypto

CFD

Currencies

Support

Gold

AUD/USD – Technical Analysis – 4h

September 23, 2025 12:02

Quick Summary

The 4-hour chart of the AUD/USD shows a dynamic trend with earlier bullish patterns followed by a bearish correction. Potential breakouts are being tested at critical levels.

This analysis outlines key areas of potential movement and market sentiment observed over the period.

Candlestick Analysis

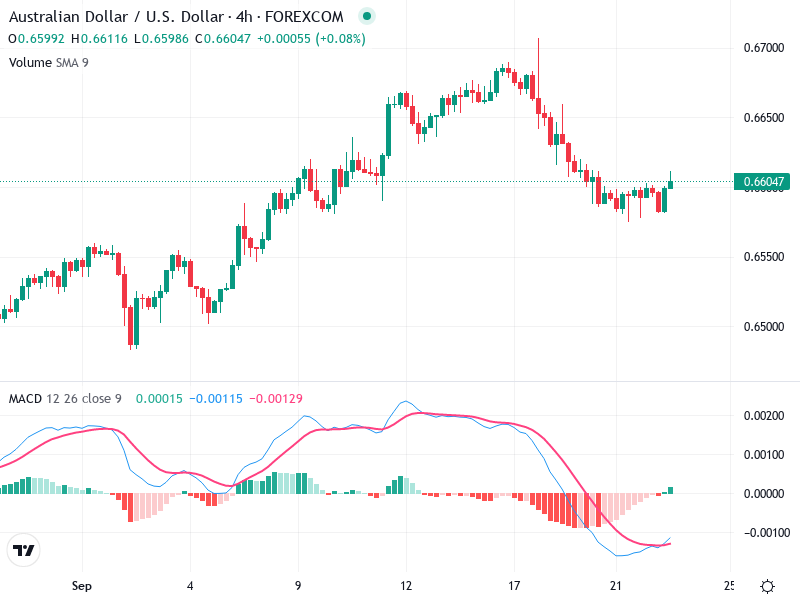
The AUD/USD experienced an initial bullish trend until mid-September, followed by a bearish pullback.

Recent candlestick patterns, including hammer and doji, indicate indecision and potential consolidation.

The price is testing a potential breakout zone around 0.6600, where a close above could signal a bullish reversal.

MACD Analysis

The MACD line is approaching a crossover above the Signal line, indicating potential bullish momentum.

The histogram is moving towards the zero line, showing decreasing bearish momentum.

No clear divergence is visible at this moment.

Volume Analysis

The volume shows moderate levels, with slight increases during the recent pullback, indicating some selling pressure.

The current volume lacks excessive spikes, suggesting a balanced market without major institutional activity.

No significant changes in volume indicate a continuation of the current trend without strong directional signals.

Support & Resistance

Support is identified around 0.6550, holding as a solid base during the recent pullback phase.

Resistance is noted between 0.6650 and 0.6660, requiring a break and sustain above this zone for a bullish trend continuation.

A confirmed break above these levels would likely signal a stronger upward movement.

Actionable Insights

A buy signal is possible with a confirmed close above 0.6650 and an increase in volume, targeting 0.6750.

If the price fails to close above 0.6600, sideways action may continue, suggesting caution for traders.

A drop below 0.6550 could indicate a continuation of the bearish trend, posing potential risks.

The AI Technical Analysis Center is an informational tool only and does not constitute investment or trading advice.
This site is registered on wpml.org as a development site. Switch to a production site key to remove this banner.