Generic selectors
Exact matches only
Search in title
Search in content
Post Type Selectors

Popular stocks

Crypto

CFD

Currencies

Support

Gold

AUD/USD – Technical Analysis – 4h

September 30, 2025 12:02

Quick Summary

The AUD/USD 4h chart highlights recent bullish developments. A bullish reversal has been observed in recent sessions, signaling a potential upward trajectory. The presence of significant patterns bolsters the bullish sentiment.

Candlestick Analysis

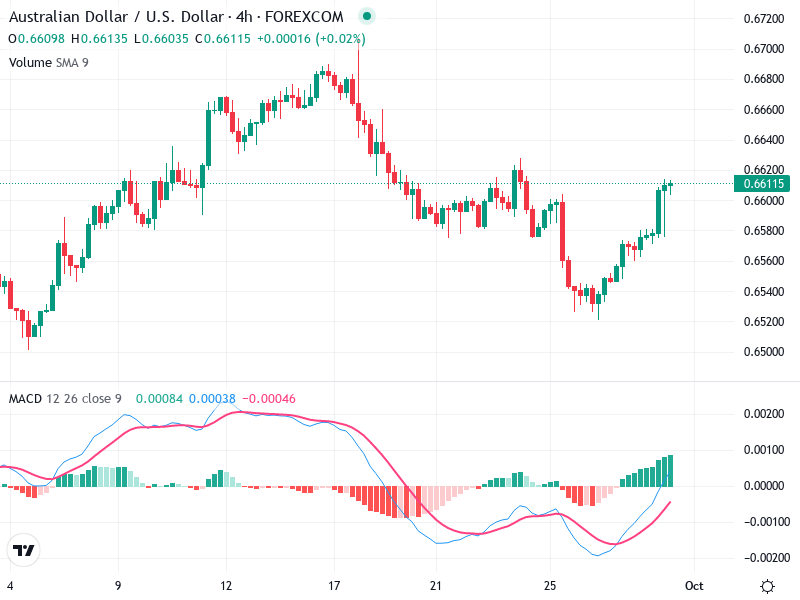
The AUD/USD chart shows a recent bullish reversal following a decline, reflecting a temporarily bullish trend due to recent upward movements.

A Bullish Engulfing pattern is visible near the recent lows, indicating a potential reversal. Several green candles in succession point to strong bullish momentum.

The recent peak around 0.6620 could act as an immediate resistance, where a breakout might trigger further bullish activity.

MACD Analysis

A bullish crossover is currently observed as the MACD line has crossed above the Signal line, hinting at potential upward momentum.

The MACD Histogram is positive and increasing, suggesting a strengthening bullish trend.

There's no evident divergence between the MACD and price action, supporting the validity of the current trend.

Volume Analysis

The current uptrend is accompanied by a steady increase in volume, reinforcing the bullish movement.

No significant volume spikes suggest strong institutional activity, but the steady volume increase is noticeable.

This volume pattern aligns with the increased bullish sentiment observed.

Support & Resistance

Support lies around 0.65400.6560, marking the recent low where the reversal initiated.

An immediate resistance level exists at around 0.6620, with a secondary resistance near 0.6680.

Monitoring these levels is crucial for determining future price movements.

Actionable Insights

Consider a buy strategy if the price breaks above 0.6620 resistance with strong volume, while ensuring the confirmation of bullish momentum through MACD and volume.

For a sell strategy, watch for bearish reversal patterns near resistance levels and potential MACD bearish crossover for profit-taking or short positions.

A hold strategy can be maintained by closely monitoring key support levels and MACD signals.

The AI Technical Analysis Center is an informational tool only and does not constitute investment or trading advice.
This site is registered on wpml.org as a development site. Switch to a production site key to remove this banner.