Generic selectors
Exact matches only
Search in title
Search in content
Post Type Selectors

Popular stocks

Crypto

CFD

Currencies

Support

Gold

AUD/USD – Technical Analysis – 4h

October 1, 2025 12:02

Quick Summary

The chart for indicates a potential change in market direction.

Key technical indicators suggest strengthening bullish momentum.

Candlestick Analysis

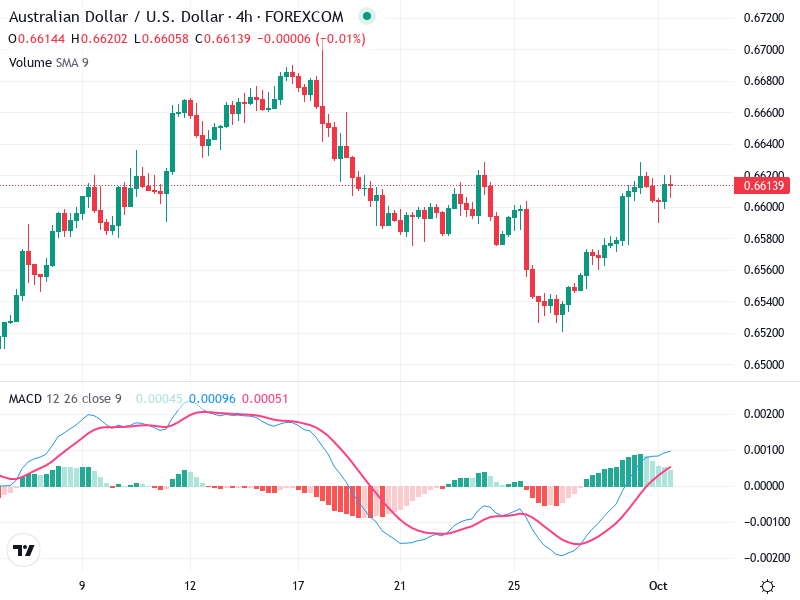
The chart shows a bullish engulfing pattern around September 26, signaling a potential reversal from the downtrend.

Initially bearish, the trend is transitioning to bullish after the reversal pattern.

There's a breakout above the 0.6600 level, which might now act as support.

MACD Analysis

A recent bullish crossover of the MACD line above the signal line indicates positive momentum.

Increasing positive values on the histogram suggest strengthening upward momentum.

No significant divergences observed at this time.

Volume Analysis

Volume increases during the reversal, supporting the upward movement.

Rising volume on bullish days reinforces the price increase.

No unusual volume spikes indicating potential institutional activity.

Support & Resistance

Support is at 0.6600; previously a resistance level, now acting as support after the breakout.

Resistance is around 0.6660, where the price previously faced selling pressure.

These levels are critical for monitoring potential reversals or continuations.

Actionable Insights

Consider entering a long position if the price consolidates above 0.6600 and the bullish momentum persists.

Watch for rejection at 0.6660, which may present a selling opportunity if confirmed.

If already long, set stops around the support to protect gains.

The AI Technical Analysis Center is an informational tool only and does not constitute investment or trading advice.
This site is registered on wpml.org as a development site. Switch to a production site key to remove this banner.