The AUD/USD chart illustrates a consolidation phase with prices oscillating between key levels. Significant candlestick patterns indicate market indecision, while technical indicators suggest caution. Traders should be prepared for potential breakouts as key levels are approached.
Candlestick Analysis
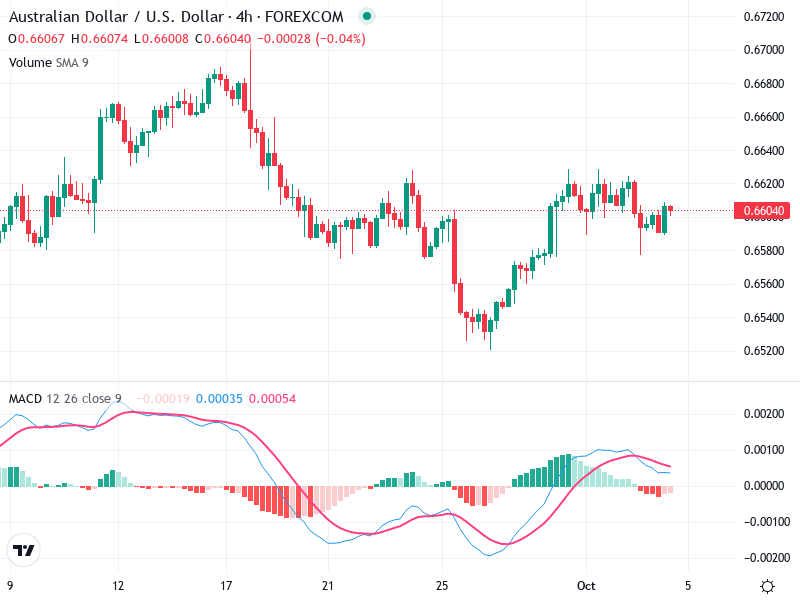
Recent candlesticks are small-bodied, highlighting market indecision.
Overall trend appears sideways, ranging between 0.6560 and 0.6620.
Resistance is observed around 0.6620 and support at approximately 0.6560.
MACD Analysis
The MACD line has crossed below the Signal line, signaling a bearish crossover.
Histogram bars are slightly negative, indicating weakening bullish momentum.
Currently, there is no clear divergence between MACD and price action.
Volume Analysis
Volume remains consistent without significant spikes.
Stable volume and sideways price movement indicate consolidation.
An increase in volume near breakout levels will be needed to confirm directional moves.
Support & Resistance
Key support level is around 0.6560.
Key resistance level is around 0.6620.
Breaching these levels with significant volume could lead to notable price movements.
Actionable Insights
Watch for volume-supported breakouts or breakdowns from the 0.6560-0.6620 range for entry signals.
Observe for new candlestick patterns for further directional clues.
Confirmation of a trend will likely require volume spikes aligned with price action.
The AI Technical Analysis Center is an informational tool only and does not constitute investment or trading advice.