March 10, 2026 08:02 EUR/USD – Technical Analysis – 4h The EUR/USD chart reveals insights into the currency pair’s recent movements. A significant bullish pattern has emerged, suggesting a potential upward shift. Traders should carefully…
March 9, 2026 13:04 GBP/USD – Technical Analysis – 4h The asset’s chart illustrates a predominantly bearish trend with recent signs of consolidation. The price is navigating key resistance and support levels which will guide…
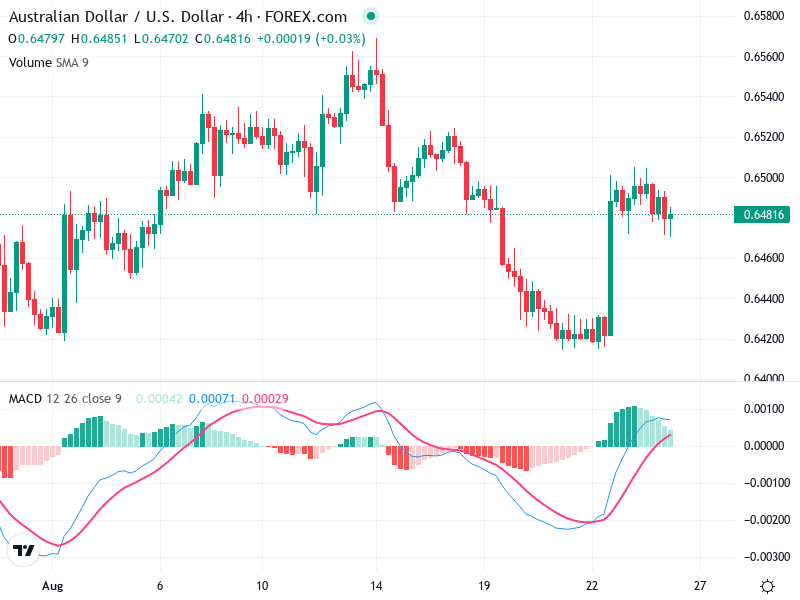
March 9, 2026 13:02 AUD/USD – Technical Analysis – 4h The current chart for the Asset shows a consolidation phase with significant support and resistance levels. The asset is currently trading within a narrow range,…