Generic selectors
Exact matches only
Search in title
Search in content
Post Type Selectors

Popular stocks

Crypto

CFD

Currencies

Support

Gold

AUD/USD – Technical Analysis – 4h

October 16, 2025 12:02

Quick Summary

The chart indicates a potential shift in trend for the asset.

Recent patterns suggest a possible bullish reversal following a prolonged bearish phase.

The asset’s price movements are showing signs of stabilizing near significant resistance levels.

Candlestick Analysis

Recently, there appears to be a potential bullish reversal pattern forming in the form of a double bottom around the 0.6440 level.

The chart shows that the pair was in a bearish trend with lower highs and lower lows throughout the observed period. However, the recent upward movement indicates a possible reversal or a move towards a sideways trend.

The area around 0.6520 is showing signs of becoming a resistance, where price was rejected on multiple occasions.

MACD Analysis

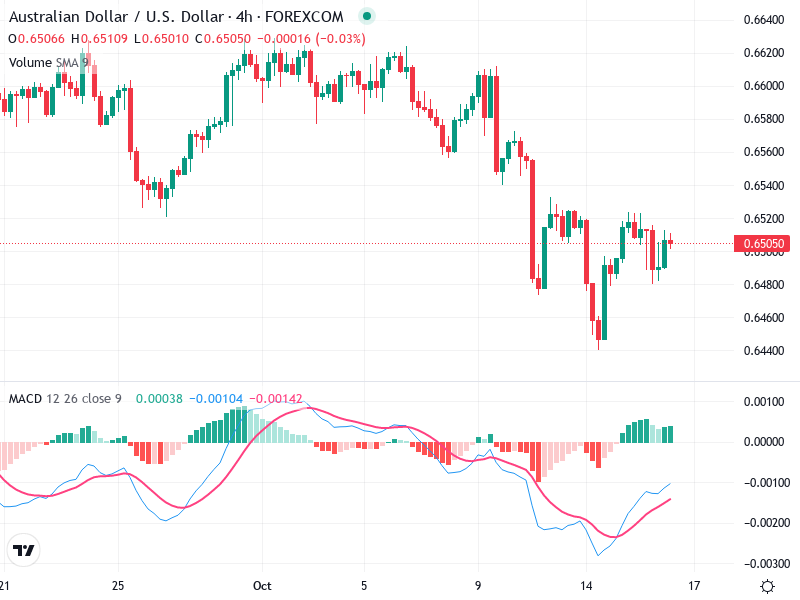
The MACD line is attempting to cross above the Signal line, which recently occurred, indicating bullish momentum. However, the crossover is not strong, suggesting cautious optimism.

The histogram has shifted from red to green, suggesting that the momentum could be turning bullish, but it remains weak for now.

There is a slight positive divergence where the MACD histogram formed higher lows while the price was making lower lows, supporting the potential for a reversal.

Volume Analysis

Volume was higher during the drop in price, consistent with increased selling interest. Recently, volume decreased on smaller upward moves, which suggests that buyers are hesitant.

The recent low-volume recovery might not have enough strength to sustain a significant upward move unless volume increases.

No significant spikes were observed indicating institutional buying or selling currently.

Support & Resistance

The primary support level is around 0.6440, where the recent lows formed.

Resistance is seen around 0.6520, which coincides with the recent price rejection zone.

Additional minor resistances may form if market sentiment weakens.

Actionable Insights

Consider buying if the price decisively breaks above the 0.6520 level with increasing volume. Watch for confirmation with sustained MACD bullish crossover and a green histogram expansion.

If the price fails to sustain above 0.6520 and begins falling back, it could be an opportunity to short, especially if MACD begins turning bearish again.

Hold current positions until a clearer trend is established above or below the identified support/resistance levels.

The AI Technical Analysis Center is an informational tool only and does not constitute investment or trading advice.
This site is registered on wpml.org as a development site. Switch to a production site key to remove this banner.