Generic selectors
Exact matches only
Search in title
Search in content
Post Type Selectors

Popular stocks

Crypto

CFD

Currencies

Support

Gold

AUD/USD – Technical Analysis – 4h

October 22, 2025 12:02

Quick Summary

The asset is displaying signs of consolidation with notable support and resistance levels. Candlestick, MACD, and volume analyses suggest a pattern of indecision and potential breakout zones. The technical indicators provide insights into possible future movements, assisting in informed decision-making.

Candlestick Analysis

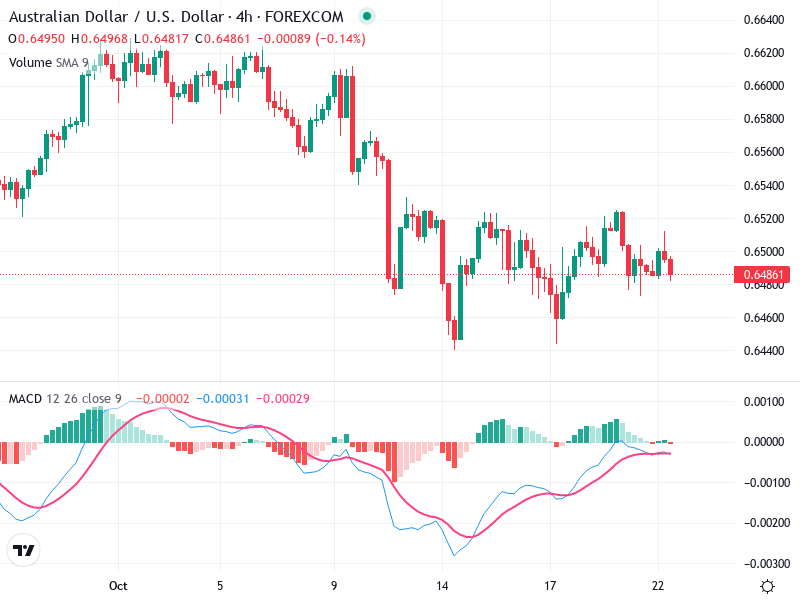
There have been series of small candlesticks forming a consolidation pattern around the 0.6480 level, indicating indecision in the market.

Previously, a bearish engulfing pattern suggested a downtrend reversal, which aligns with the intermittent downtrend observed.

The overall trend appears to be sideways to slightly bearish, fluctuating within a tight range.

MACD Analysis

The MACD line is very close to the signal line with a potential for bearish crossover, indicating mild bearish momentum.

The histogram is slightly below the zero line, suggesting weak bearish momentum.

No significant divergences observed between the MACD and the price action currently.

Volume Analysis

Volume has decreased over time, typical in consolidation phases which supports the sideways price movement.

Lack of volume spikes indicates a lack of strong buying or selling pressure from institutional players at this time.

Previous volume increases did coincide with price drops, suggesting panic selling or liquidation.

Support & Resistance

Strong support noted at 0.6460, where past pullbacks have found buying interest.

Resistance encountered at 0.6520, where sellers have stepped in to sell previous rallies.

A break above the resistance or below the support could signal the next directional move.

Actionable Insights

Hold: Given the current consolidation, it may be prudent to await a clearer breakout or breakdown before initiating new positions.

Consider buying on confirmation of a bullish breakout above 0.6520.

Selling could be considered if price breaks below the support at 0.6460 with increased volume.

The AI Technical Analysis Center is an informational tool only and does not constitute investment or trading advice.
This site is registered on wpml.org as a development site. Switch to a production site key to remove this banner.