Generic selectors
Exact matches only
Search in title
Search in content
Post Type Selectors

Popular stocks

Crypto

CFD

Currencies

Support

Gold

AUD/USD – Technical Analysis – 4h

October 30, 2025 13:02

Quick Summary

The AUD/USD 4-hour chart indicates potential bearish sentiment with recent strong bearish candles.

This is reinforced by the MACD’s bearish crossover, suggesting increased downward pressure.

Candlestick Analysis

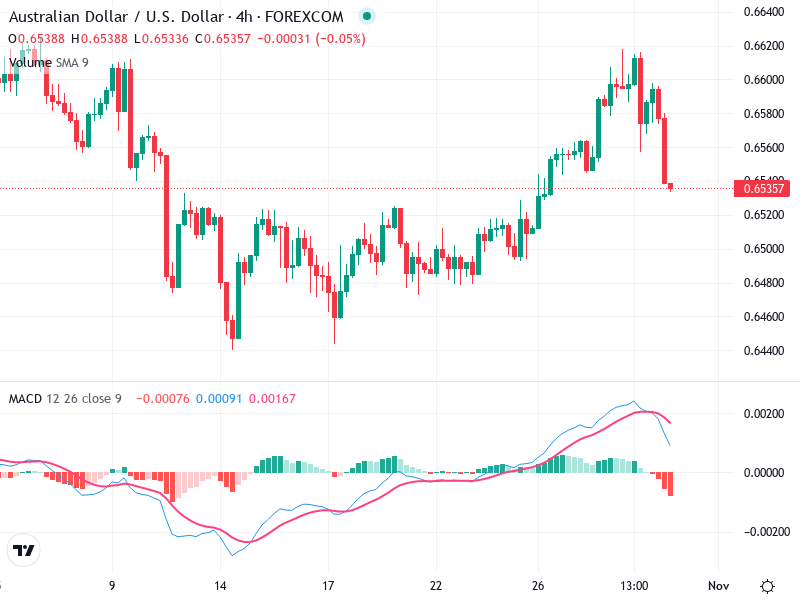
The chart shows a potential bearish engulfing pattern toward the end, indicating a reversal from the recent uptrend.

The price seemed to be in a short-term uptrend following a sideways movement, but the recent bearish candles indicate a potential reversal or correction.

Around 0.6620, there's noticeable resistance, where the recent uptrend faced rejection.

MACD Analysis

The MACD line has crossed below the Signal line, suggesting bearish momentum.

The histogram has moved into negative territory, reinforcing bearish momentum.

There is no significant divergence noted between MACD and price; both are moving downward.

Volume Analysis

No significant volume spikes observed. The volume has generally been consistent with the price movement.

The lack of a volume spike suggests minor institutional activity, aligning with the price trend.

Volume remains steady, reflecting the moderate activity in the market.

Support & Resistance

Resistance is around 0.6620, as noted from prior price action where upward movement was halted.

Support is approximately 0.6480, which has been tested multiple times and may serve as a safety net if the price continues to decline.

Key levels to watch for any breakouts or retests.

Actionable Insights

Consider shorting if price action continues to confirm the bearish trend, particularly if the price breaks below the 0.6530 area with increased volume.

Traders should wait for confirmation before entering positions due to the recent market volatility.

Watch for confirmation of the trend through prolonged bearish price action and increasing volume at support or resistance levels.

The AI Technical Analysis Center is an informational tool only and does not constitute investment or trading advice.
This site is registered on wpml.org as a development site. Switch to a production site key to remove this banner.