October 31, 2025 13:04
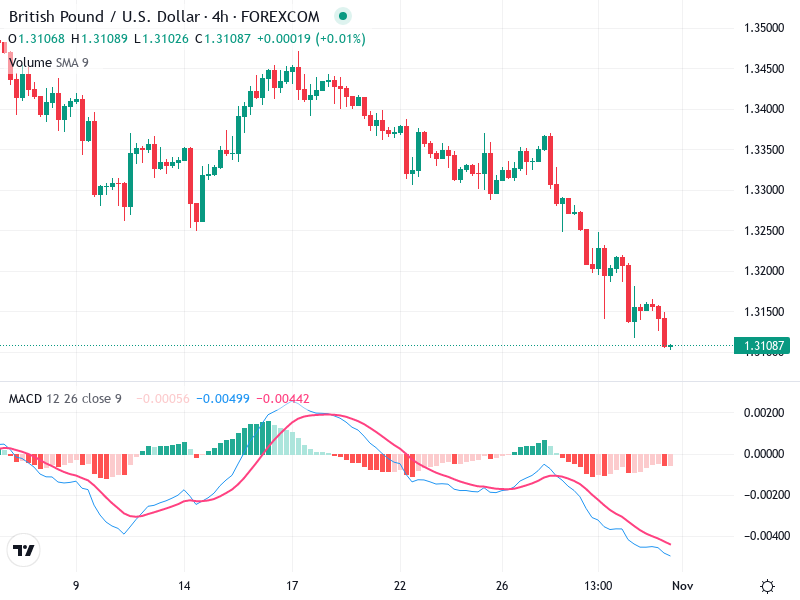
GBP/USD – Technical Analysis – 4h
The 4-hour chart of GBP/USD displays a notable bearish outlook, underpinned by lower highs and lows. Key levels around 1.3100 and 1.3250 are critical for…
Read more