Generic selectors
Exact matches only
Search in title
Search in content
Post Type Selectors

Popular stocks

Crypto

CFD

Currencies

Support

Gold

AUD/USD – Technical Analysis – 4h

November 4, 2025 13:02

Quick Summary

The asset chart currently shows a bearish trend, influenced by several factors. Recent candlestick patterns and MACD indicators suggest potential downward momentum.

The asset has broken below significant support levels, indicating increased bearish sentiment in the market.

Candlestick Analysis

Recent candles exhibit a bearish trend as red candlesticks dominate, indicating strong selling pressure.

A potential hammer pattern near the current price suggests possible reversal, contingent on the following candlestick.

The trend remains bearish after breaking down from the recent high near 0.66200.

MACD Analysis

The MACD line lies below the Signal line, indicating a bearish crossover and ongoing downward momentum.

Negative histogram bars are growing in size, supporting sustained bearish momentum.

No clear divergence between the MACD and price; both align in a continued downtrend.

Volume Analysis

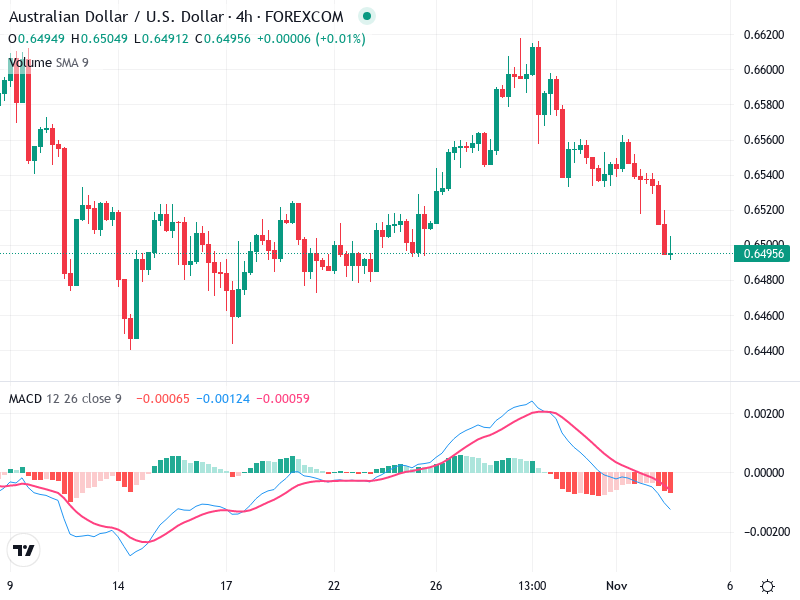
Volume remains stable without significant spikes, indicating a lack of strong institutional buying or selling.

The price decline lacks significant volume increase, suggesting weakening selling pressure unless volume rises.

No unusual volume spikes, signifying a lack of strong conviction by major traders.

Support & Resistance

Support is currently forming around the 0.64900 level.

Resistance is identified at approximately 0.65200, where the recent breakdown occurred.

Falling below current support might lead to more downside; rejection at resistance may affirm the bearish trend.

Actionable Insights

Holding or monitoring for a reversal signal is advisable before buying due to current bearish indicators.

Consider selling if the price drops below new support with volume confirmation.

Monitor for a green candlestick following the hammer pattern as an indication of a possible reversal.

The AI Technical Analysis Center is an informational tool only and does not constitute investment or trading advice.
This site is registered on wpml.org as a development site.