Generic selectors
Exact matches only
Search in title
Search in content
Post Type Selectors

Popular stocks

Crypto

CFD

Currencies

Support

Gold

AUD/USD – Technical Analysis – 4h

November 7, 2025 13:03

Quick Summary

The chart under analysis is for the Asset. It shows significant price movements, highlighting the resistance at 0.650 and support around 0.644. The consolidation phase hints at potential upcoming changes.

The recent bearish crossover in the MACD and low volume further support the sideways trend. The Asset’s price action appears poised for a breakout in either direction, necessitating close observation.

Candlestick Analysis

The chart shows a recent downward trend after reaching a peak on October 26.

Currently, the trend appears sideways with prices consolidating around the 0.648 level.

No clear bullish or bearish patterns like the engulfing, doji, or hammer are obvious as of now.

MACD Analysis

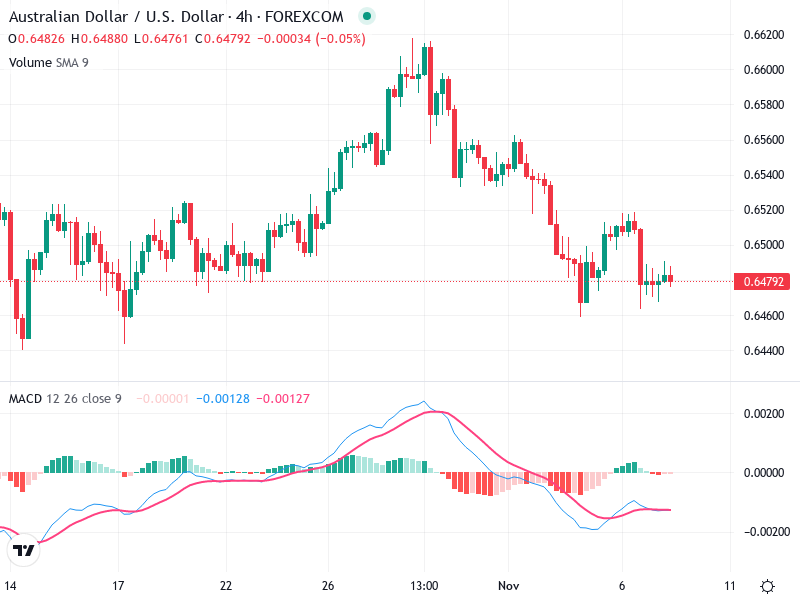
The MACD line is slightly below the Signal line, indicating a recent bearish crossover, which usually suggests bearish momentum.

The histogram provides insight into weakening bearish momentum, as the bars are getting smaller.

No significant divergence is noted between the price and MACD.

Volume Analysis

Volume remains relatively low during the consolidation phase, supporting the sideways price action.

There is no significant volume spike contradicting the price movements indicating no strong institutional activity.

No significant unusual spikes are visible.

Support & Resistance

Support is around the 0.644 level, which has been tested recently without breaking lower.

Resistance is around 0.650, which has shown to be a resistance zone during the pullback.

The analysis of these levels is crucial for strategizing potential market entries and exits.

Actionable Insights

Watch for a break above 0.650 with strong volume to consider a potential buy.

Consider selling or shorting if price breaks below 0.644 with volume increase, confirming a continuation of the bearish trend.

Hold during this consolidation period, waiting for clearer signals of a trend continuation or reversal.

The AI Technical Analysis Center is an informational tool only and does not constitute investment or trading advice.
This site is registered on wpml.org as a development site. Switch to a production site key to remove this banner.